Saved Bookmarks
| 1. |
Draw the graph of y=sin^(-1)|sin x|and y=(sin^(-1)|sinx|)^(2),0lexle2pi |
|
Answer» Solution :We have `y=f(X)=SIN^(-1)|sinx|,0lexle2pi` `{{:(sin^(-1)(sin x),0lexltpi),(-sin^(-1)(sin x),pilexle2pi):}` `{{:(x, 0lexltpi/2),(pi-x,pi/2lexltpi):}` `{{:(x, 0lexltpi/2),(pi-x,pi/2lexltp),(-(pi-x),pilexlt(3pi)/(2)),(-(x-2pi),(2pi)/2(3pi)/(2)lexlt2pi):}` `{{:(x, 0lexltpi/2),(pi-x,pi/2lexltp),(-(pi-x),pilexlt(3pi)/(2)),(x-2pi,(3pi)/(2)lexlt2pi):}` The graph of `y=f(x)` is as SHOWN in the following figure. 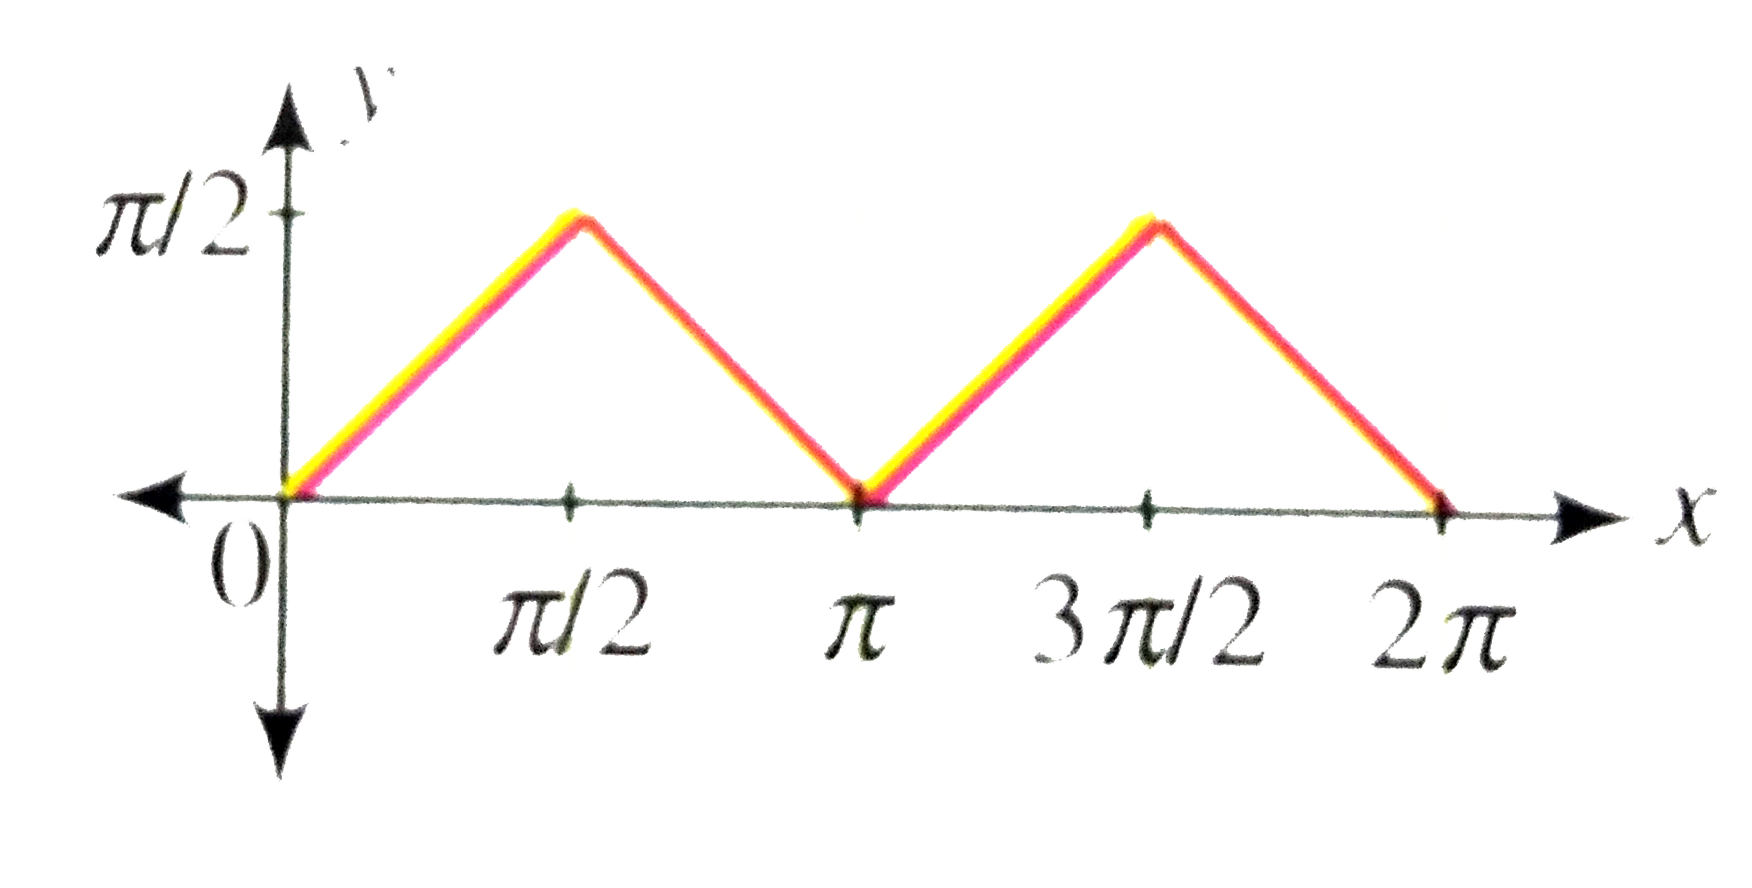 `y=g(x)=(sin^(-1)|sin x|)^(2), 0 lexle2pi` `{{:(x^(2),0lexltpi/2),((pi-x)^(2),pi/2lexltpi),((x-pi)^(2),pilexlt(3pi)/2):}={{:(x^(2),0lexltpi/2),((pi-x)^(2),pi/2lexltpi),((2pi-x)^(2),(2pi)/2lexlt2pi):}` `y=x^(2)` is parabola having VERTEX at (0,0) `y=(x-pi)^(2)` is a parabola having vertex at `(pi,0)` `y=(x-2pi)^(2)`is a parabola having vertex at `(2pi,0)` The graph of `y=g(x)` is as shown in the followin figure. 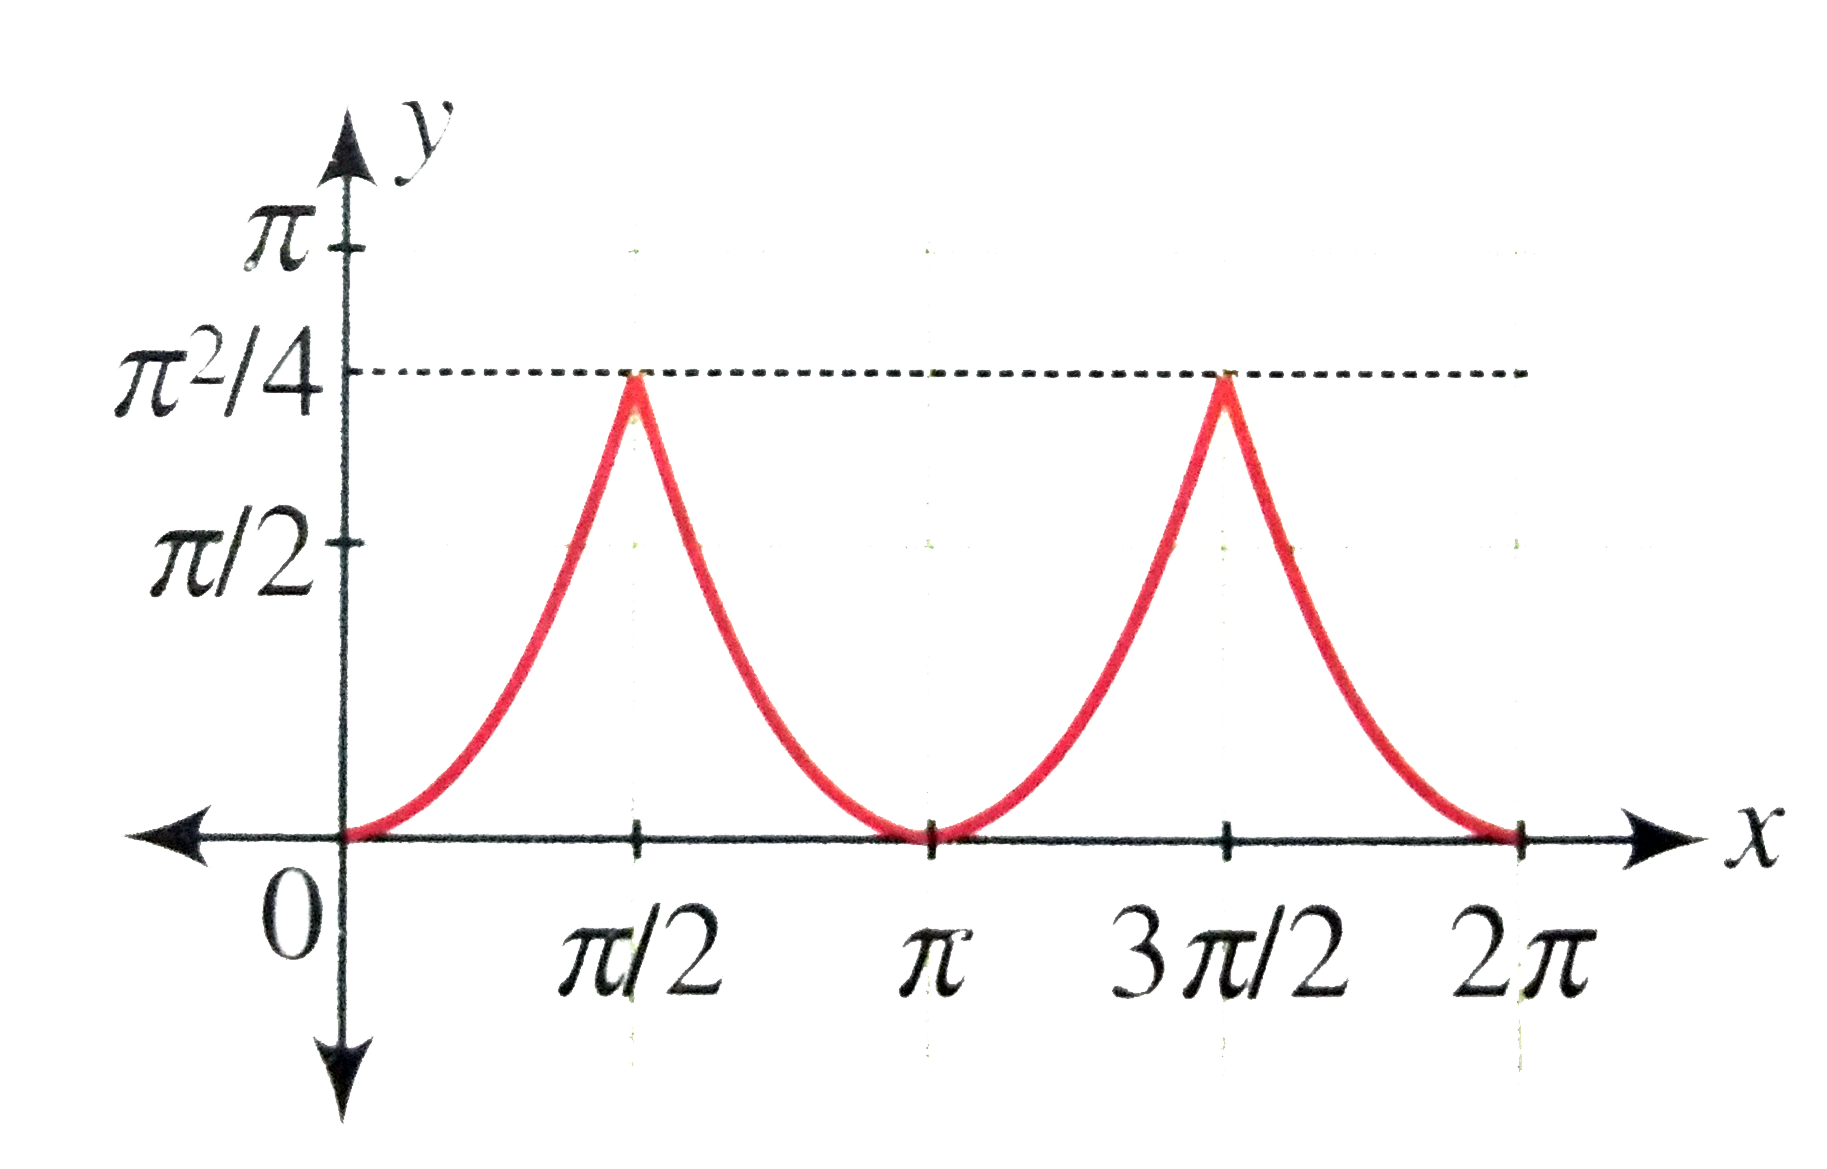
|
|