Saved Bookmarks
| 1. |
Draw the graph of y = tan^(2) x. |
|
Answer» Solution :We have `y = f(x) = tan^(2) x` Period of the function is `pi`. Function is EVEN, so the graph is symmetrical above the x - axis. Let us DRAW the graph for `0 lt x lt pi//2`. For `0 lt x lt pi//4, 0 lt tan x lt 1` `therefore` `tan^(2) x lt tan x` For `x gt pi//4` `tan x gt 1` `therefore` `tan^(2) x gt tan x` Hence the graph of `y = tan^(2) x` lies below and above the graph of y = tan x for `x in (0, pi//4)` and `x in (pi//4, pi//2)`. So the graph of the function for `x in (-pi//2, pi//2)` is as SHOWN in the FOLLOWING figure. 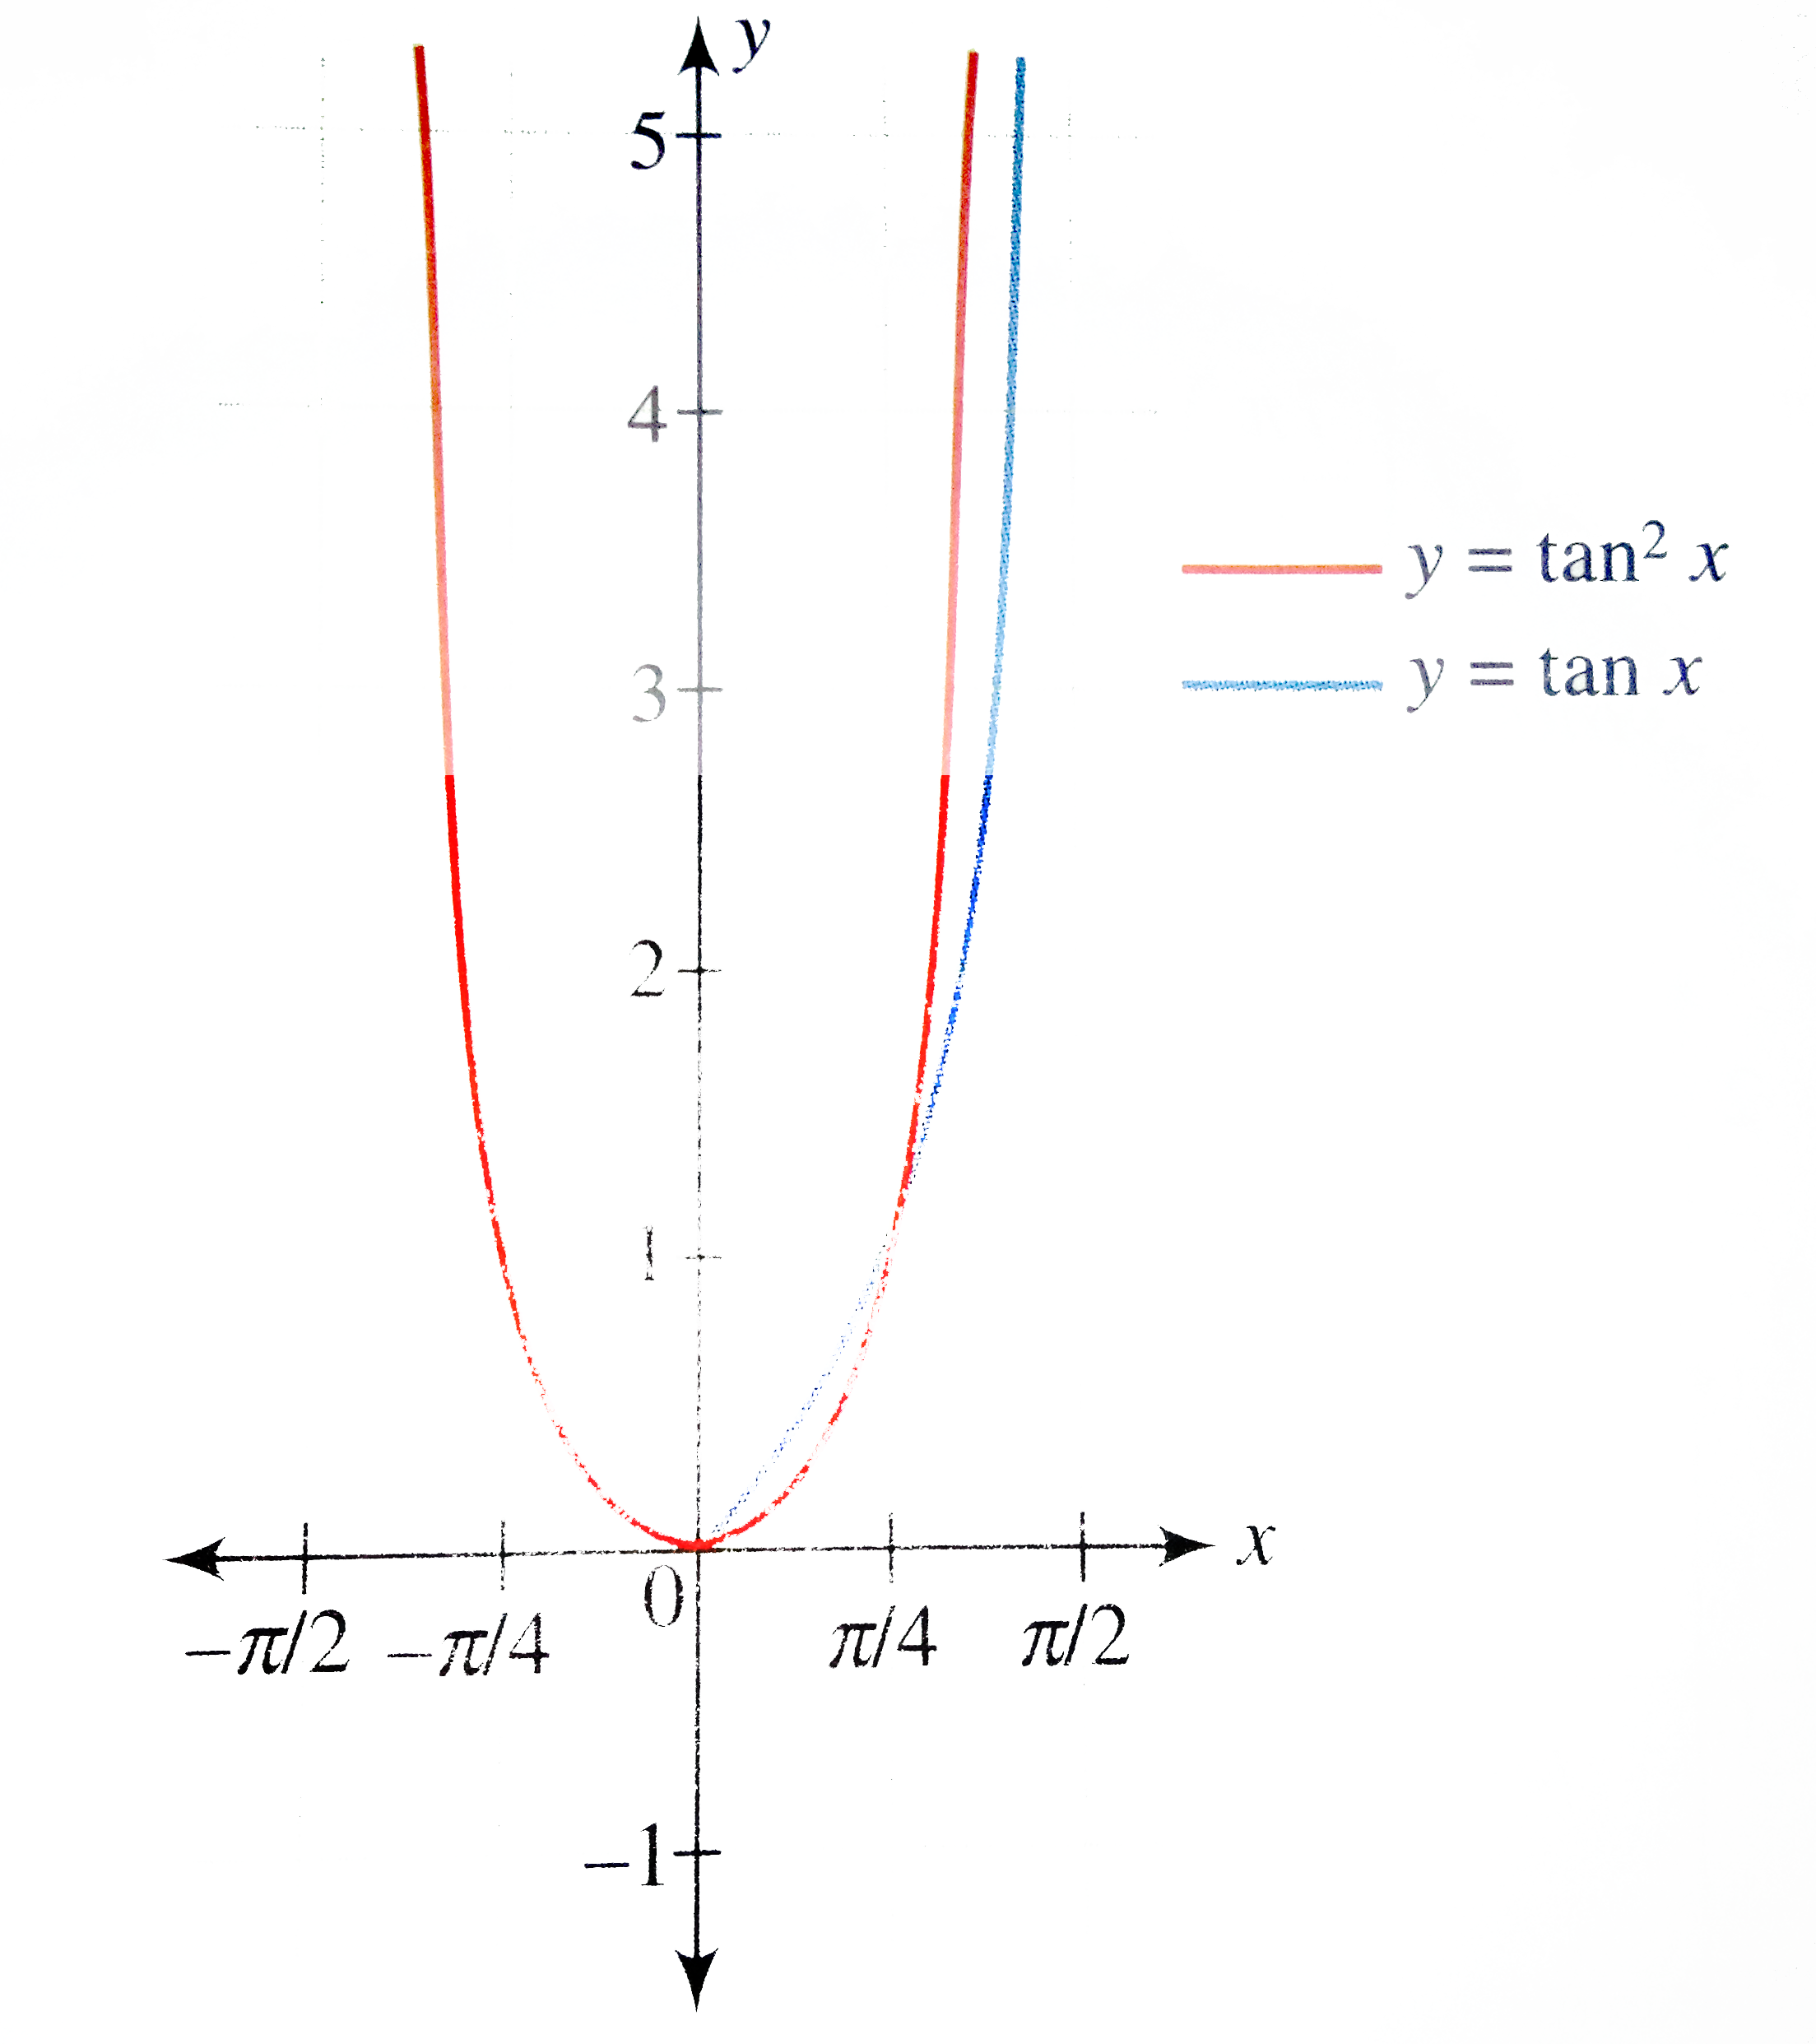 Since the function has period `pi` , the graph of the function is as shown in the following figure. 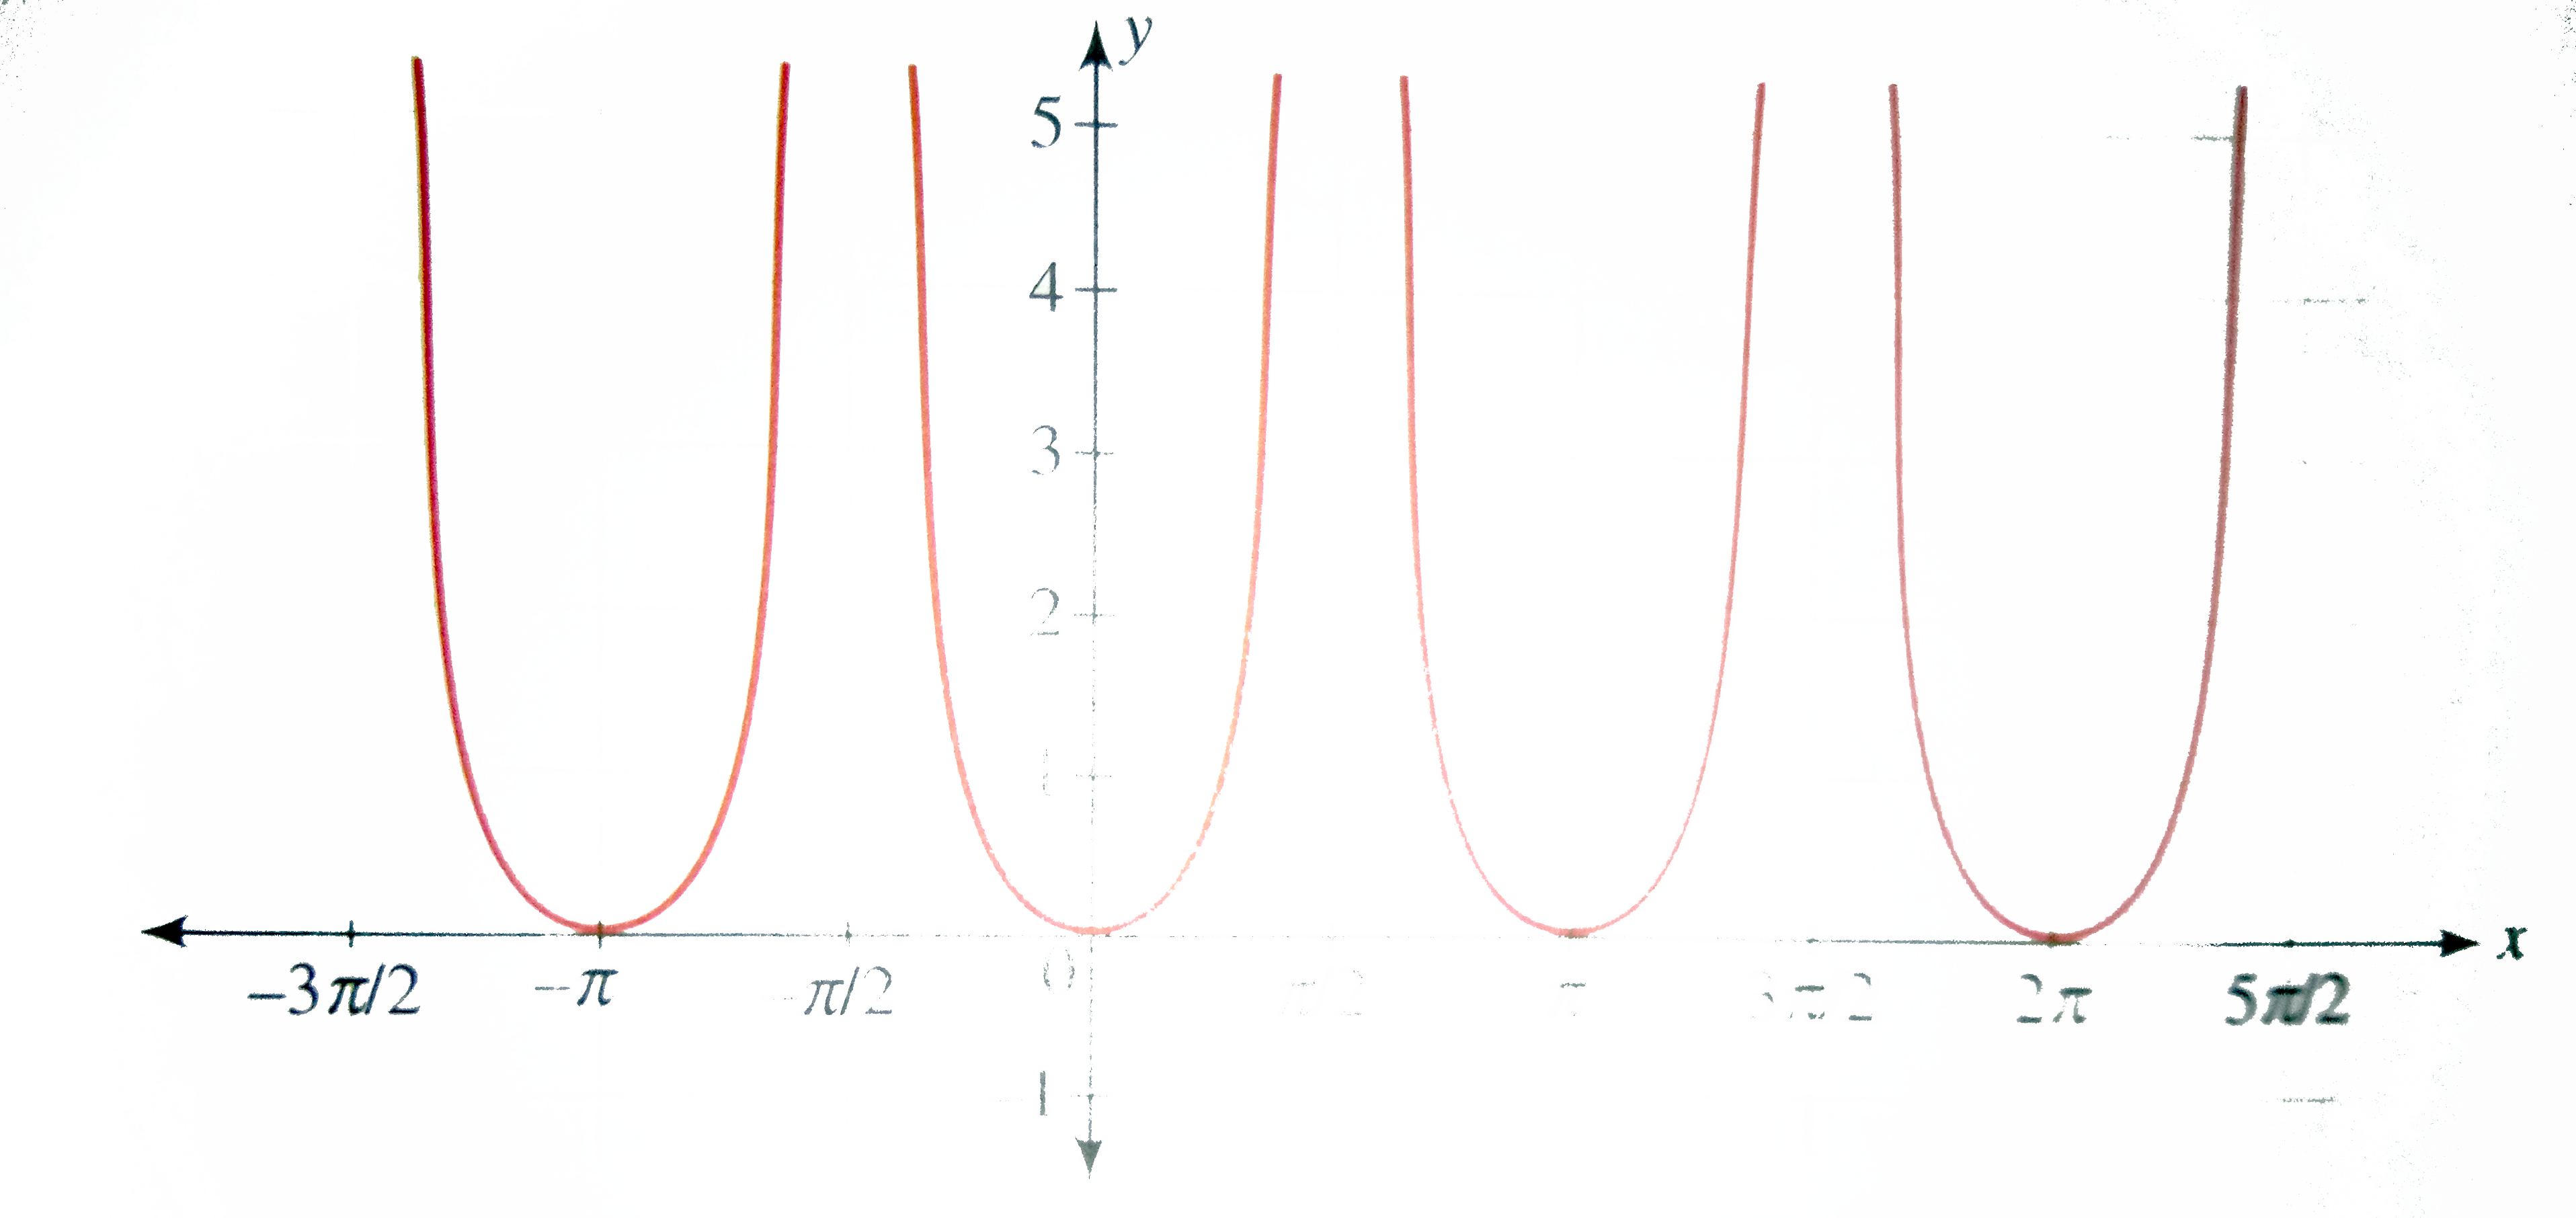
|
|