1.

In the given (V-T) diagram, what is the relation between pressures P_(1) and P_(2) ?

Answer» <html><body><p>`P_(2) gt P_(<a href="https://interviewquestions.tuteehub.com/tag/1-256655" style="font-weight:bold;" target="_blank" title="Click to know more about 1">1</a>)`<br/>Cannot be <a href="https://interviewquestions.tuteehub.com/tag/predicted-7271267" style="font-weight:bold;" target="_blank" title="Click to know more about PREDICTED">PREDICTED</a><br/>`P_(2) = P_(1)`<br/>`P_(2) gt P_(1)`</p><a href="https://interviewquestions.tuteehub.com/tag/solution-25781" style="font-weight:bold;" target="_blank" title="Click to know more about SOLUTION">SOLUTION</a> :According to ideal gas equation <br/> PV = nRT or `V = (nRT)/(P)` <br/> For an isobaric process, P = constant and `V prop T` <br/> Therefore, V - T graph is a straight line passing through origin. <a href="https://interviewquestions.tuteehub.com/tag/slope-15649" style="font-weight:bold;" target="_blank" title="Click to know more about SLOPE">SLOPE</a> of this line is inversely proportional to P. In the given figure, <br/> `("Slope")_(2) gt ("Slope")_(1) :. P_(2) lt P_(1)
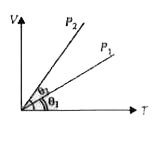
` <br/> <img src="https://d10lpgp6xz60nq.cloudfront.net/physics_images/MTG_NEET_GID_PHY_XI_C08_E03_008_S01.png" width="80%"/></body></html>


Discussion

No Comment Found