
Saved Bookmarks
| 1. |
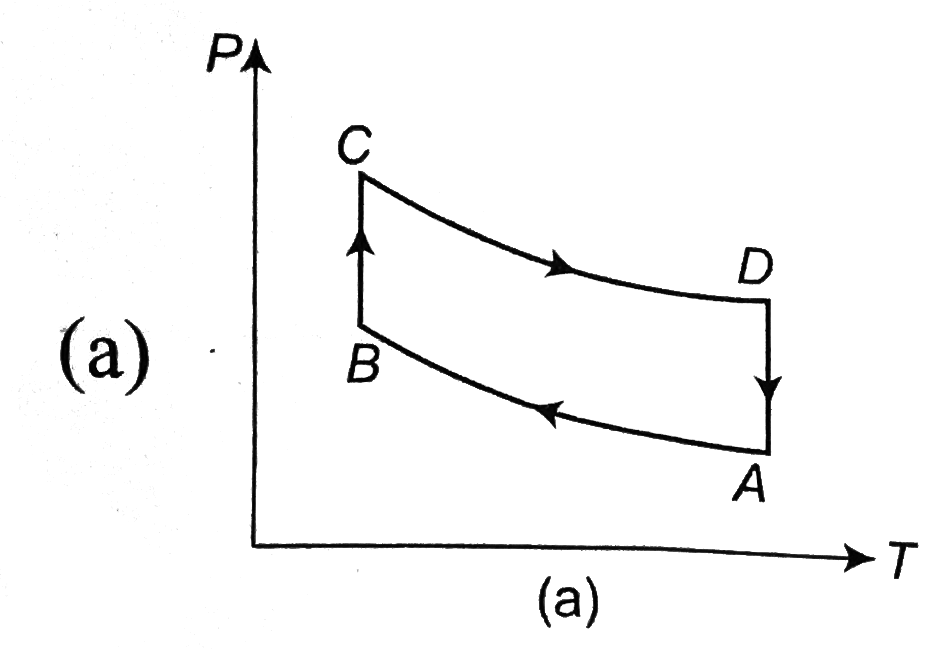
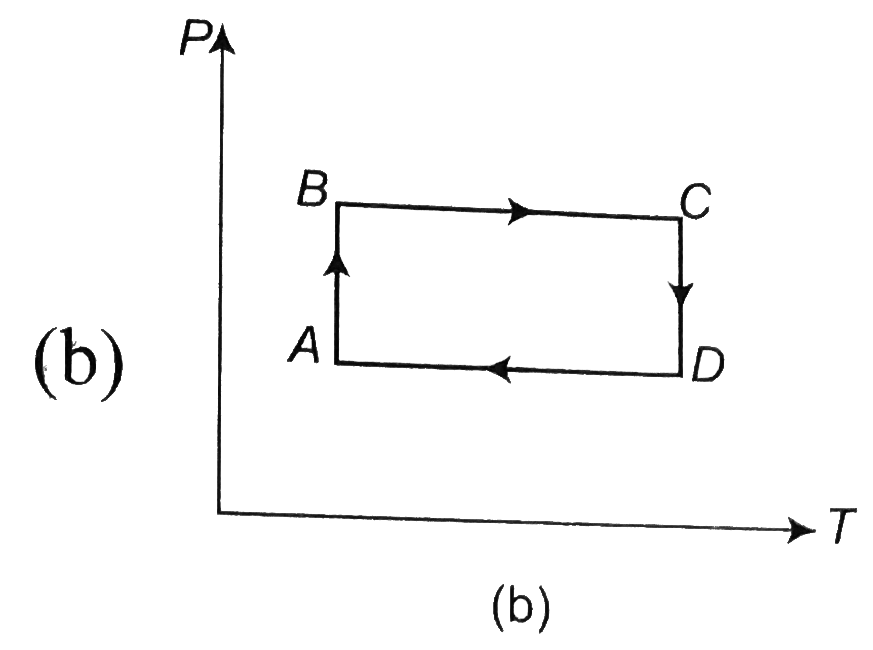
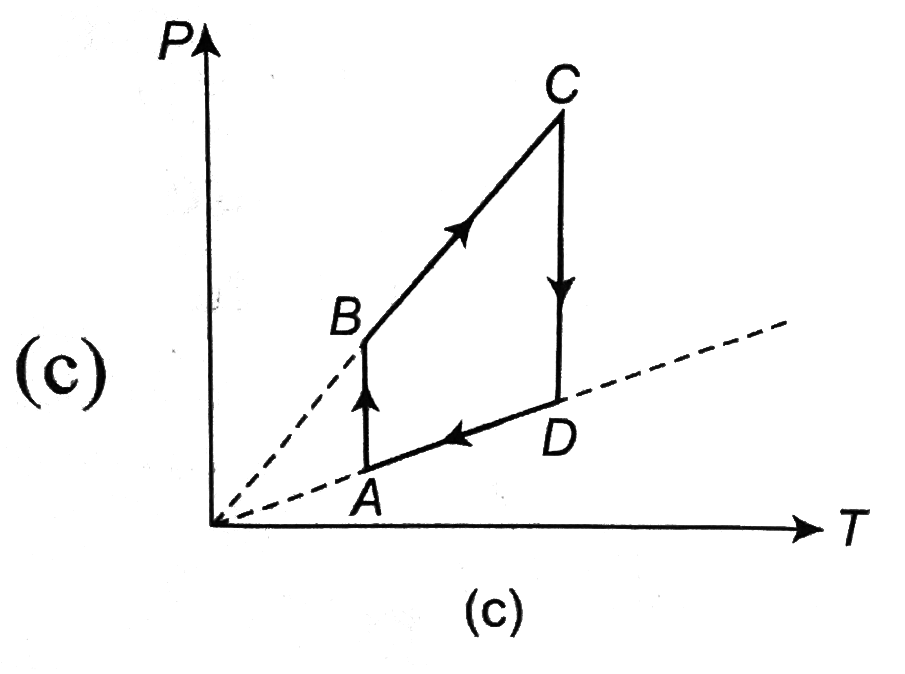
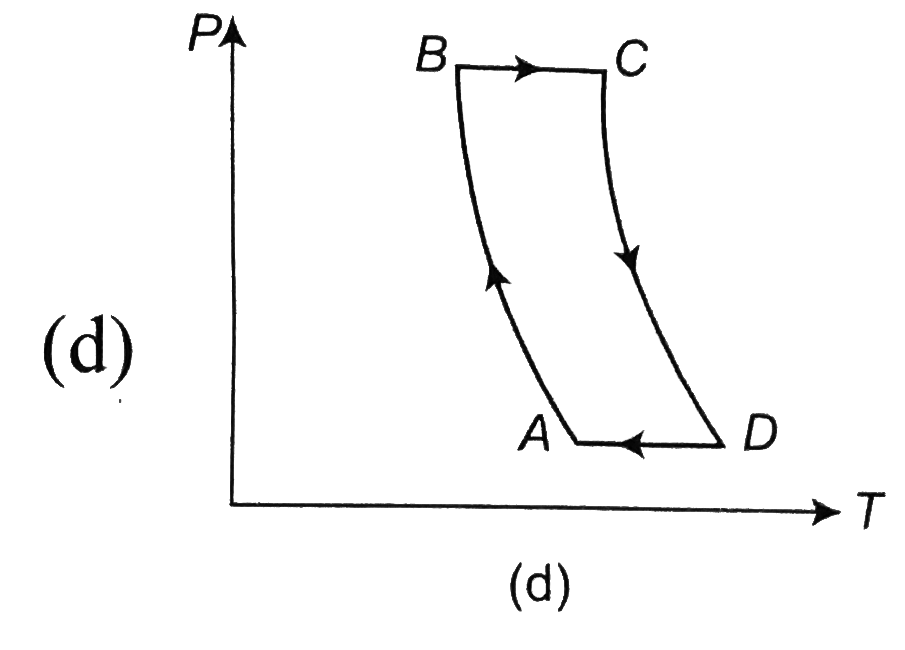
Density vs volume graph is shown in the figure. Find corresponding pressure vs temperature graph |
|
Answer»
(V decrease, `rho` increases) In isothermal PROCESS (`T` = constant), `rho prop 1/V` As `V` decreases, `P` increases. so, the `rho` increase, `V` decrease (`rhoV` CURVE) and `P` increase for `V` decrease (`P-T` curve) Options (B) and (c) may be correct. But process `B-C` is shown by a DOT in `(rho-V)` curve. It means `BC` is a isochoric process. Process `BC` in option (c) is a isochoric process because `P prop T`. |
|