Saved Bookmarks
| 1. |
Draw the graph of y=2cosx + sin2x |
|
Answer» Solution :We have `y=f(X) = 2cosx+ sin2x` Clearly, DOMAIN of the function is R. Also `f(x)` is periodic with period `2PI`. So we NEED to draw the graph for the interval for the interval `[0,2pi]`. `f(0) =0` `f(x)=0` `therefore 2cosx+2sincosx=0` `therefore 2cosx(1+sinx)=0` `therefore cosx=0` or `sinx=-1` `therefore x=pi//2` or `x=(3pi)//2` `f^(')(x) = -2sinx+2cosx2x` `=-2(2sin^(2)x+sinx-1)` `=-2(2sinx-1)(sinx+1)` `f^(')(x) =0` `therefore sinx=1//2` or `sinx=-1` `therefore x=pi//6, (5pi)/6` or `x=(3pi)/2` `f(pi//6) = 2cos(pi//6) + sin(pi//3)` `=(3sqrt(3))/2` `f(5pi//6) = 2cos(5pi//6+sin(5pi//3))` `=-3sqrt(3)/2` `f(3pi//2)=0` So important points on graph paper as shown in the following figure. 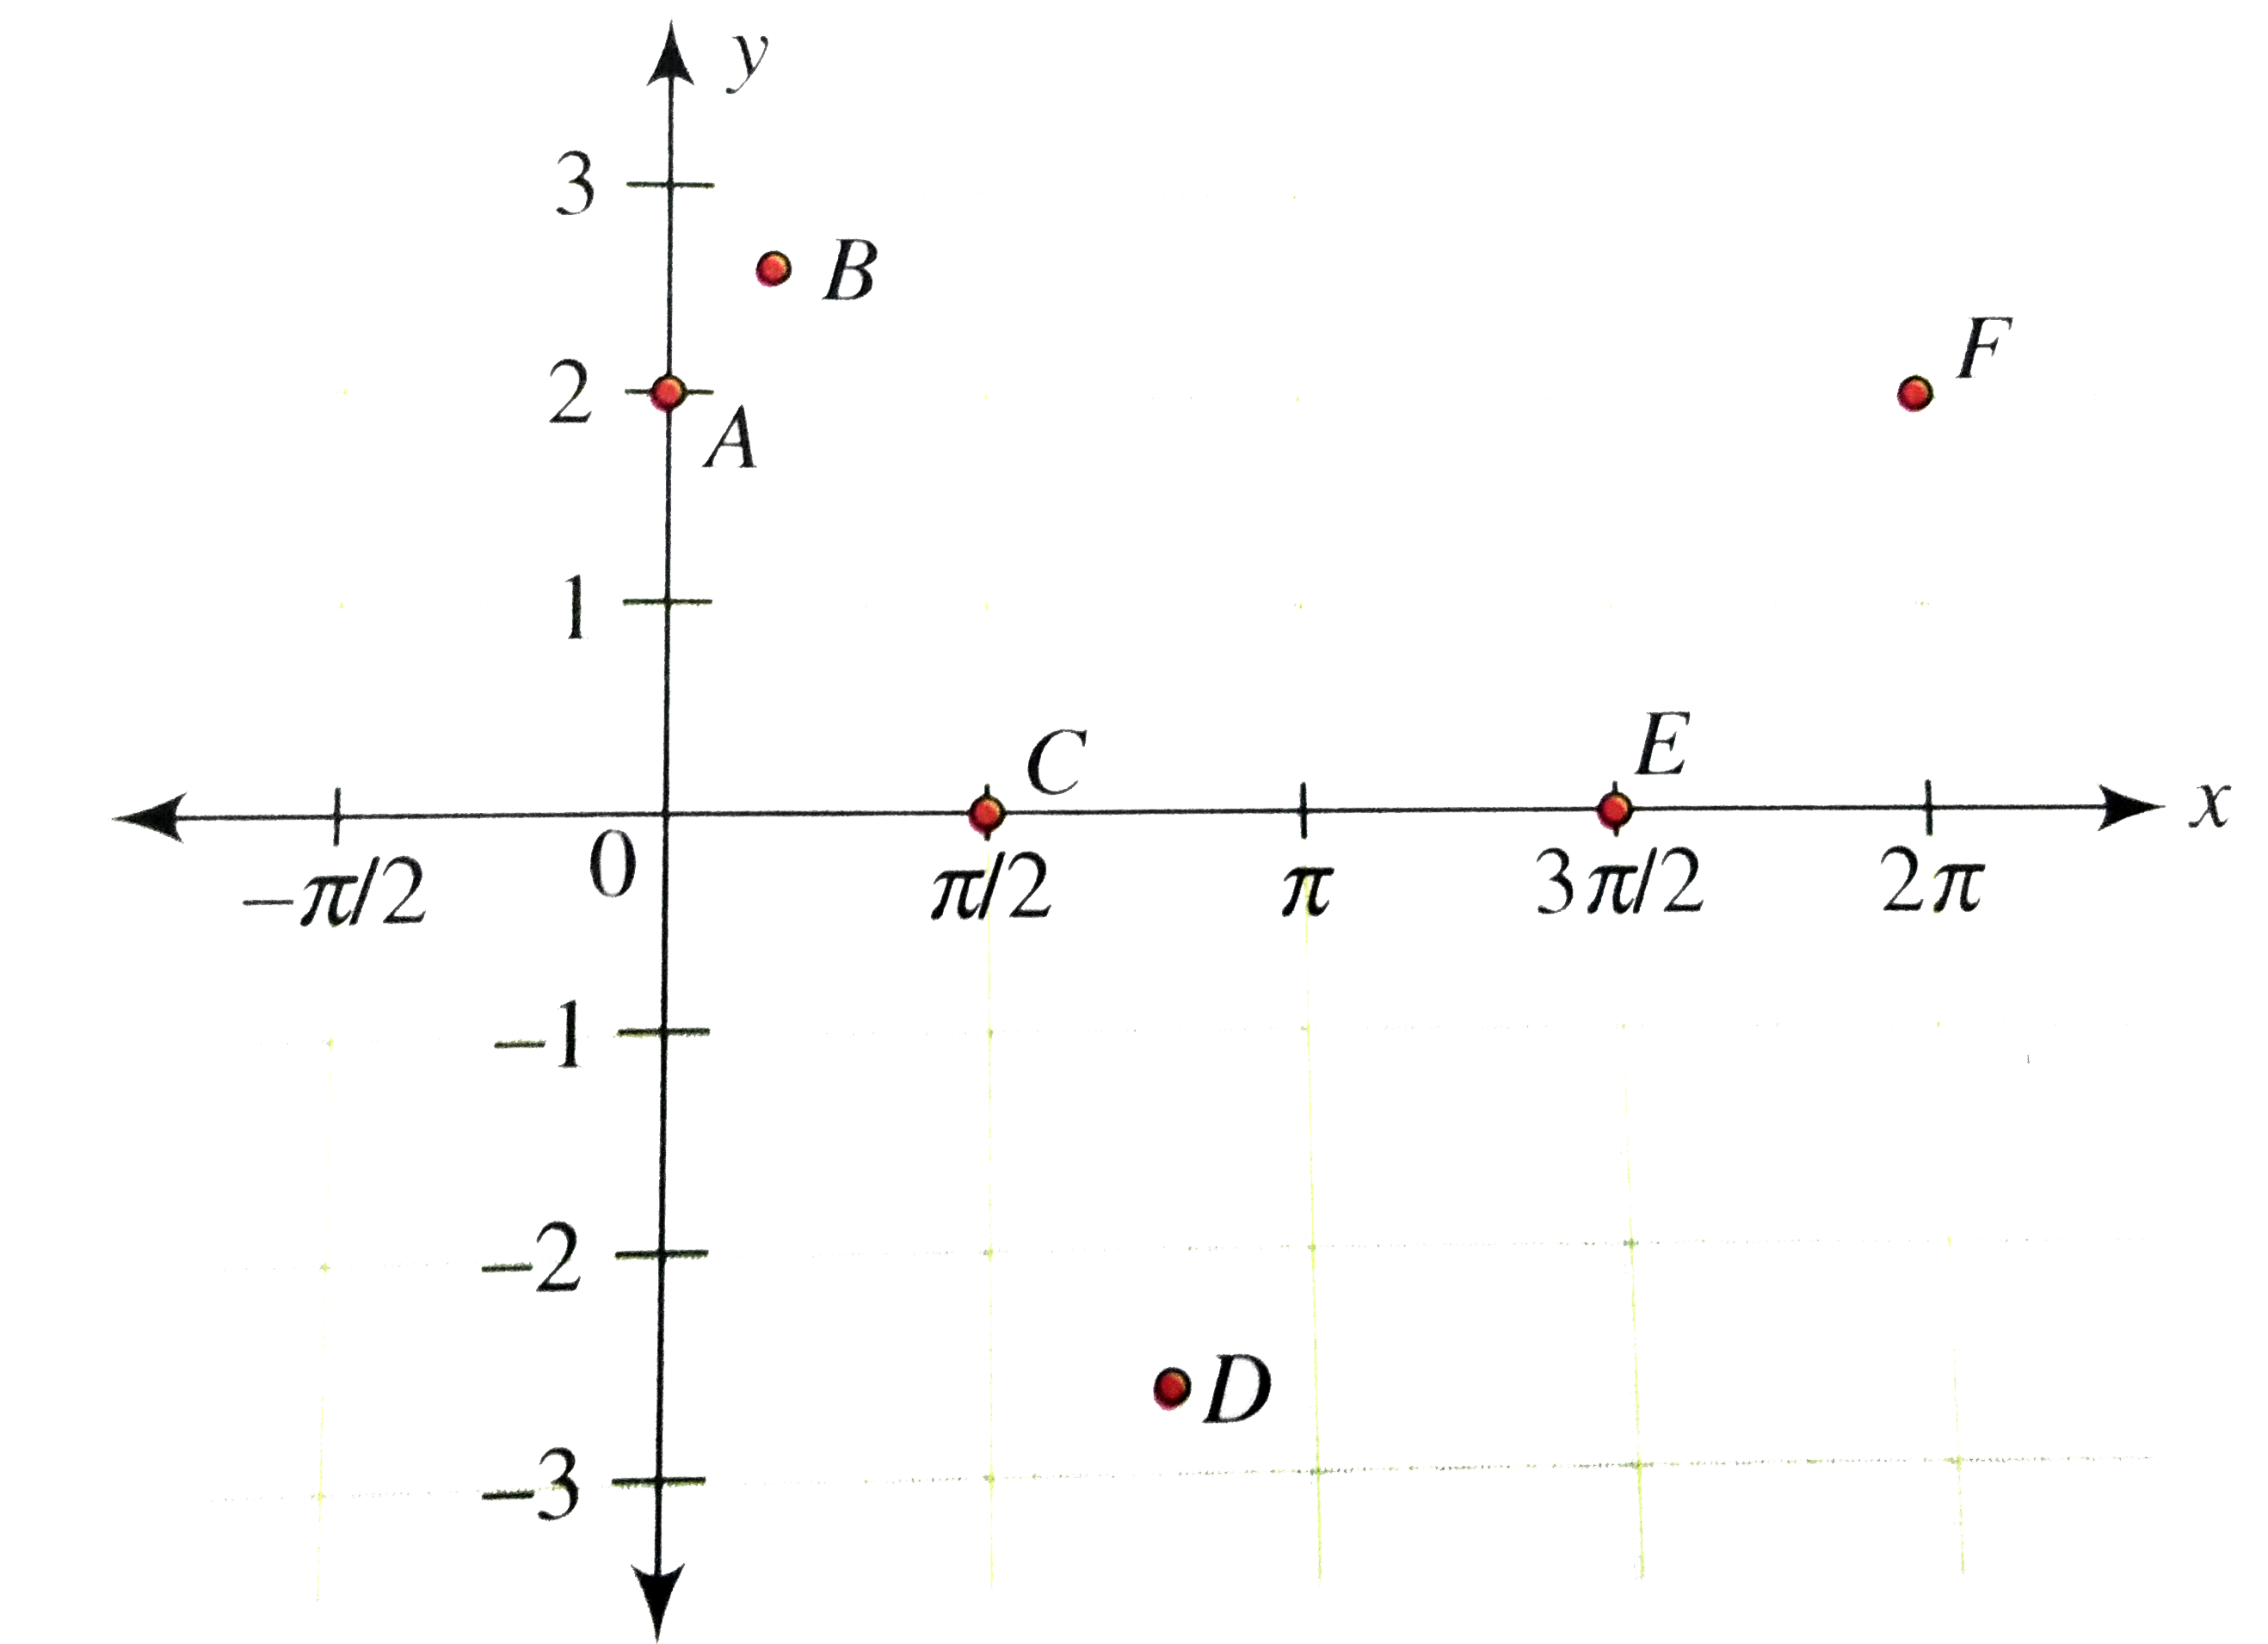 From the points A to B, f(x) increases, from points B to D, f(x) decreases intersecting the x-axis at C, from points D to F, f(x) increases intersecting the x-axis at E. Further `f^('')(x)=-2 cosx-4sin2x` `f^('')(x) =0`at `x=(3pi//2)`, hence it is the point of inflection. Since functions have period `2pi`, the graph of`y=f(x)` for `x in R` is as shown in the following figure. 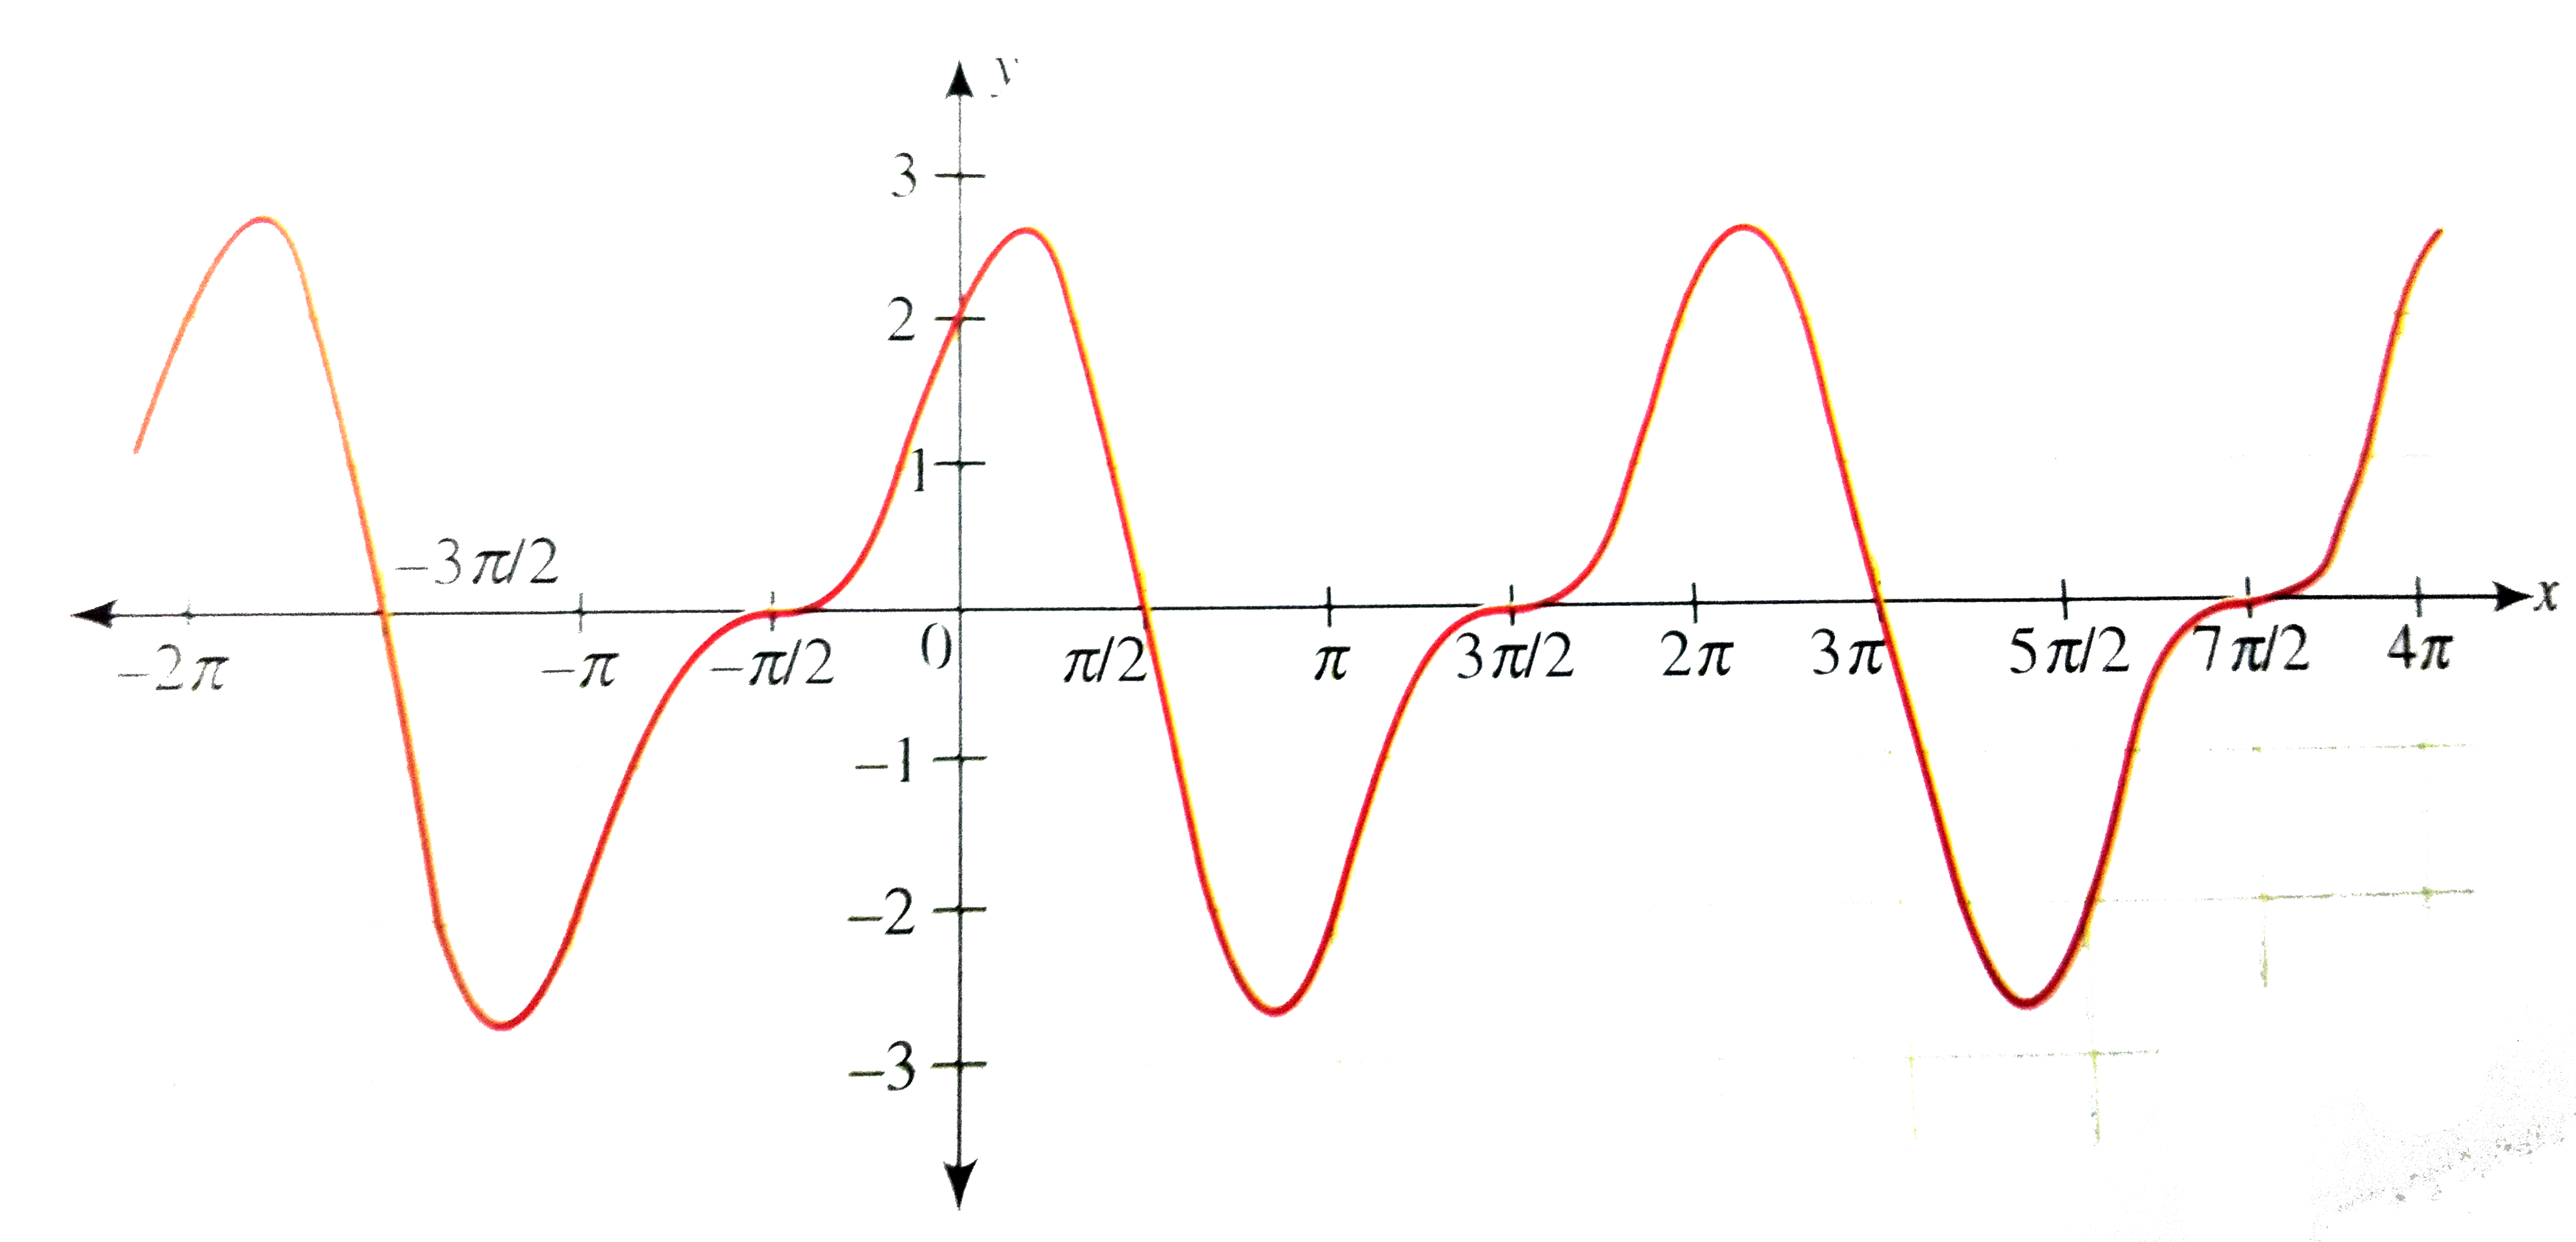
|
|