Saved Bookmarks
| 1. |
Draw the graph of y = log_(e) (sin x). |
|
Answer» Solution :We have `y = f(x) = log_(e) (sin x)` Clearly, y = f(x) is defined when `sin x gt 0`, i.e. x lies in the `1^(st)` and `2^(nd)` QUADRANTS only expect the quadrant ANGLE. ALSO we have `0 lt sin x le 1` `therefore` `-oo lt log_(e)(sin x) le 0` PERIOD of y = f(x) is `2pi`. However, the function is not defined in `(PI, 2pi)`. The graph is for `(0, pi)` only. Now when `x to 0^(+) or x to pi^(-), sin x to 0^(+)`, for which `log_(e)(sin x) to -oo` Also `f(pi//2) = log_(e)(1) = 0` `f'(x) = cot x,` `f''(x) - "cosec"^(2)x lt 0` Hence the graph is concave downwards. The graph of the function for `x in (0, pi)` is as shown in the following figure. 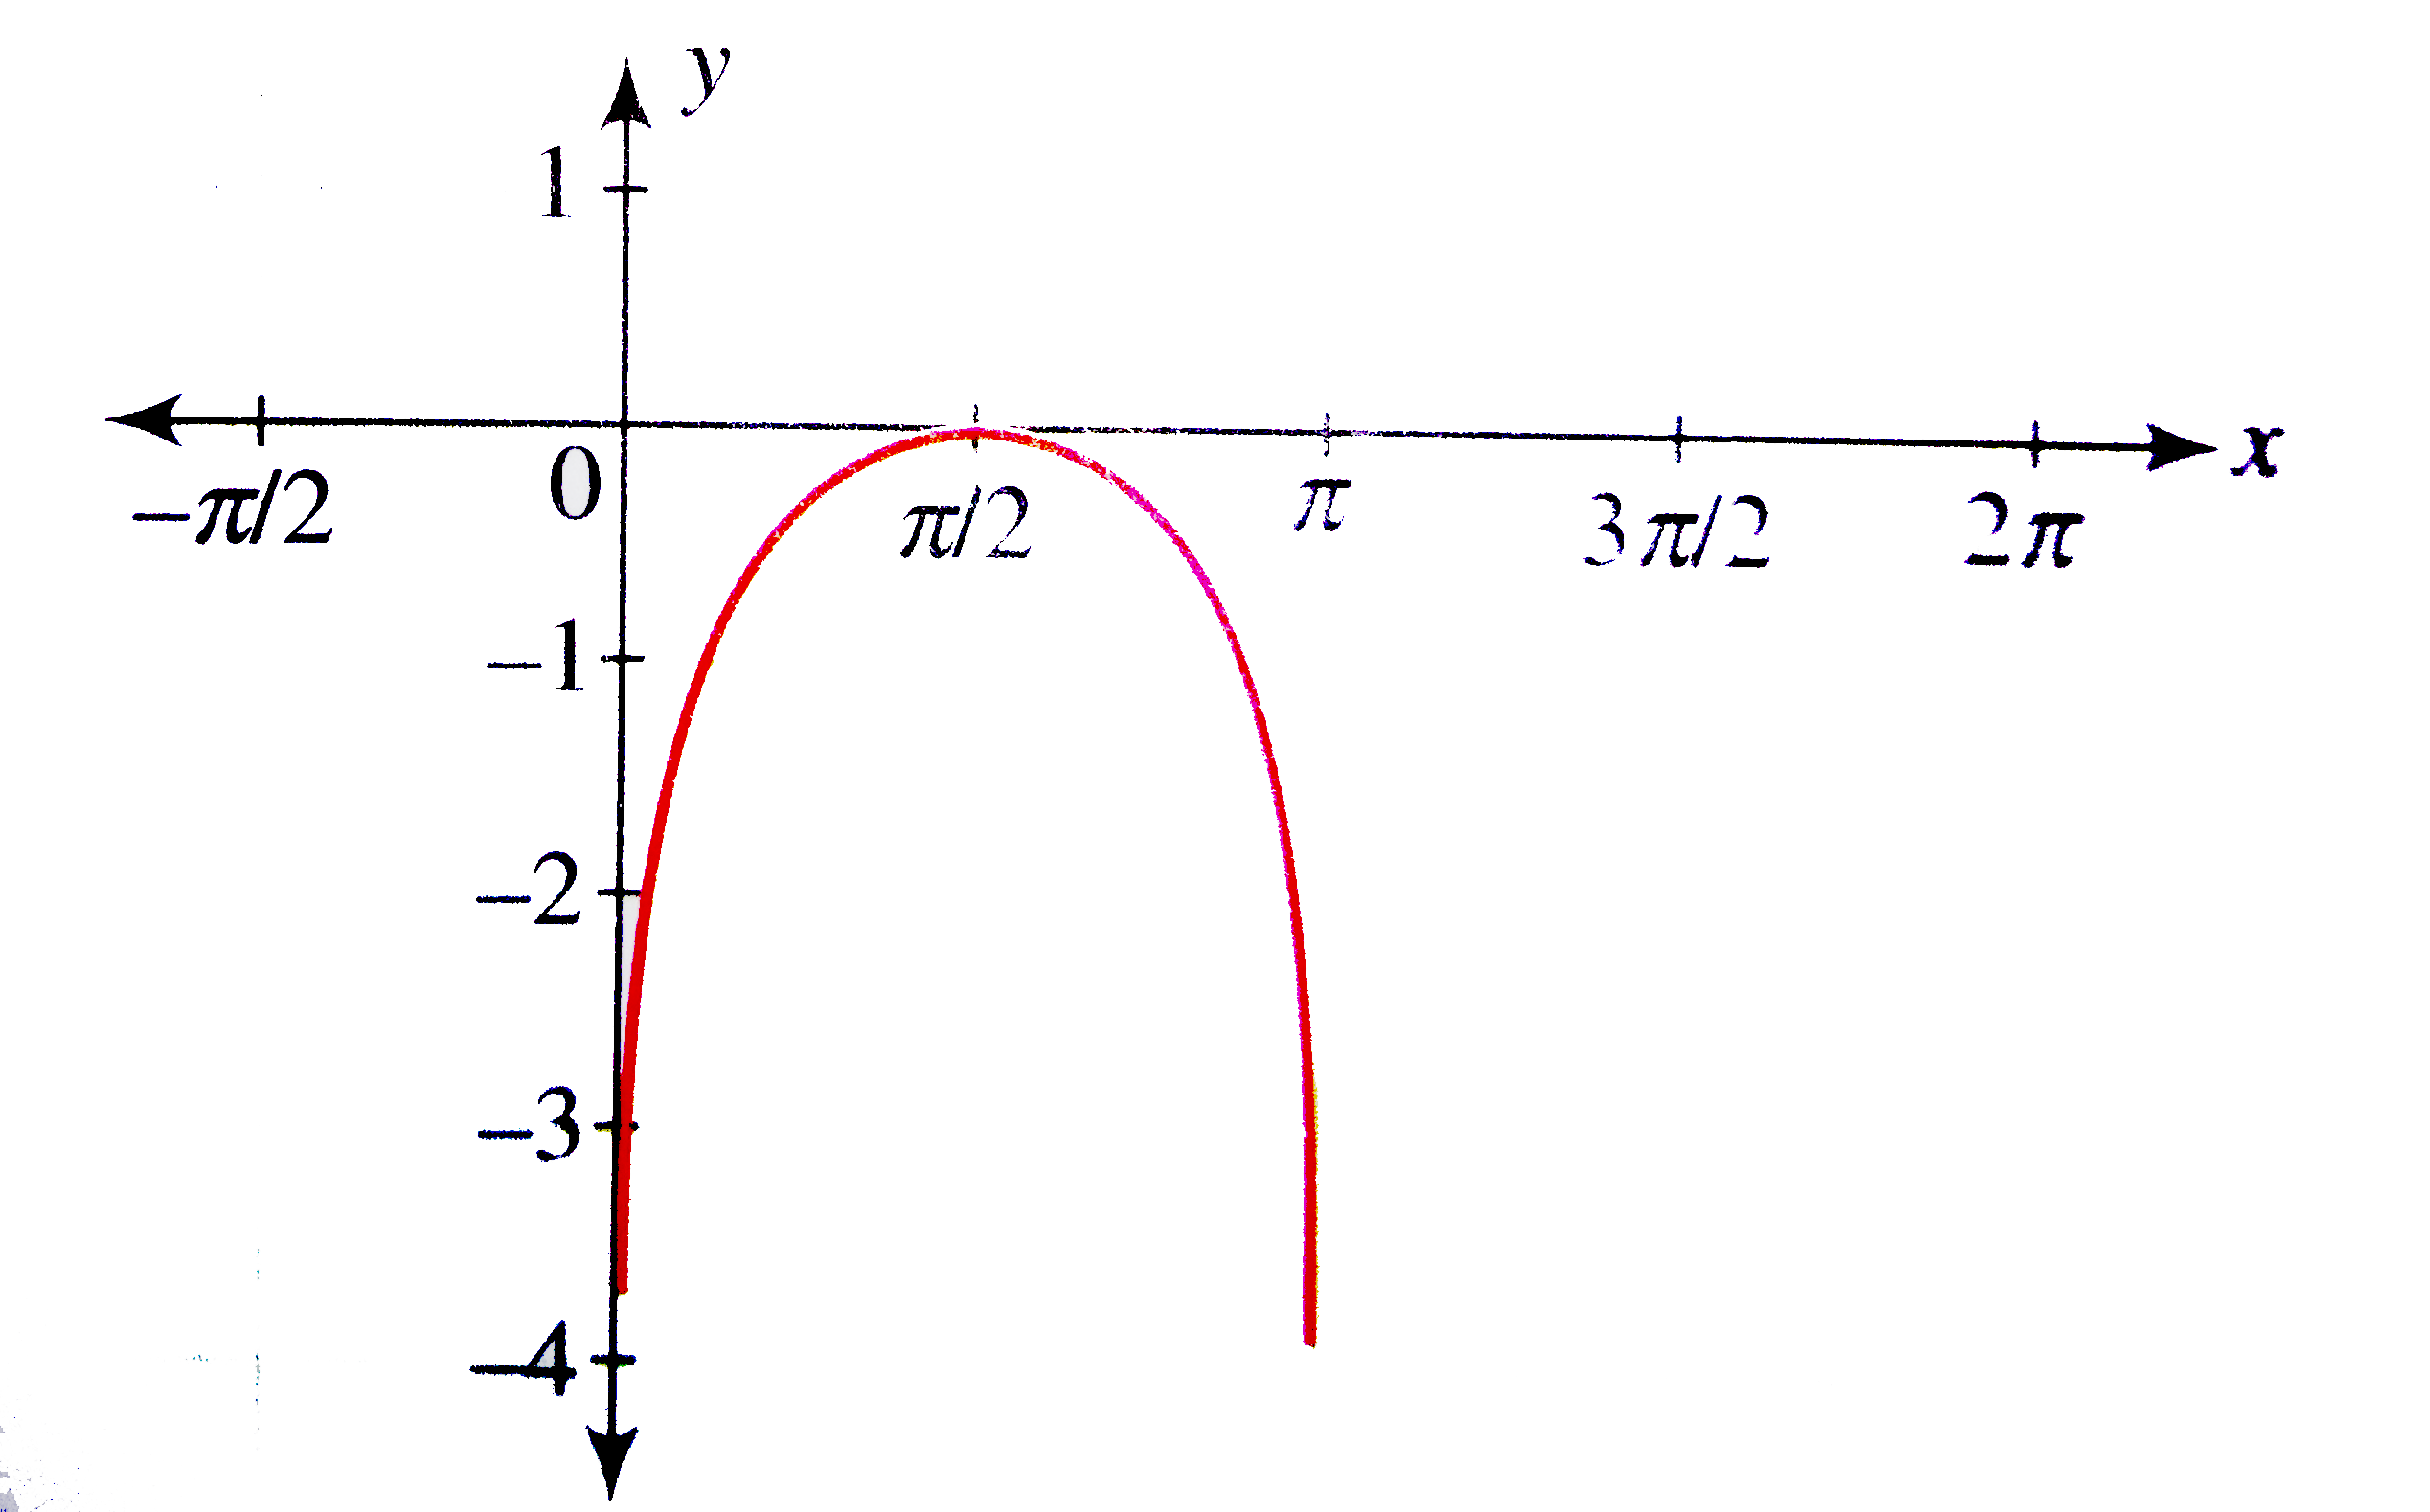 We have same graphs of intervals `... (-2pi, - pi), (2pi, 3pi), (4pi, 5pi)...` 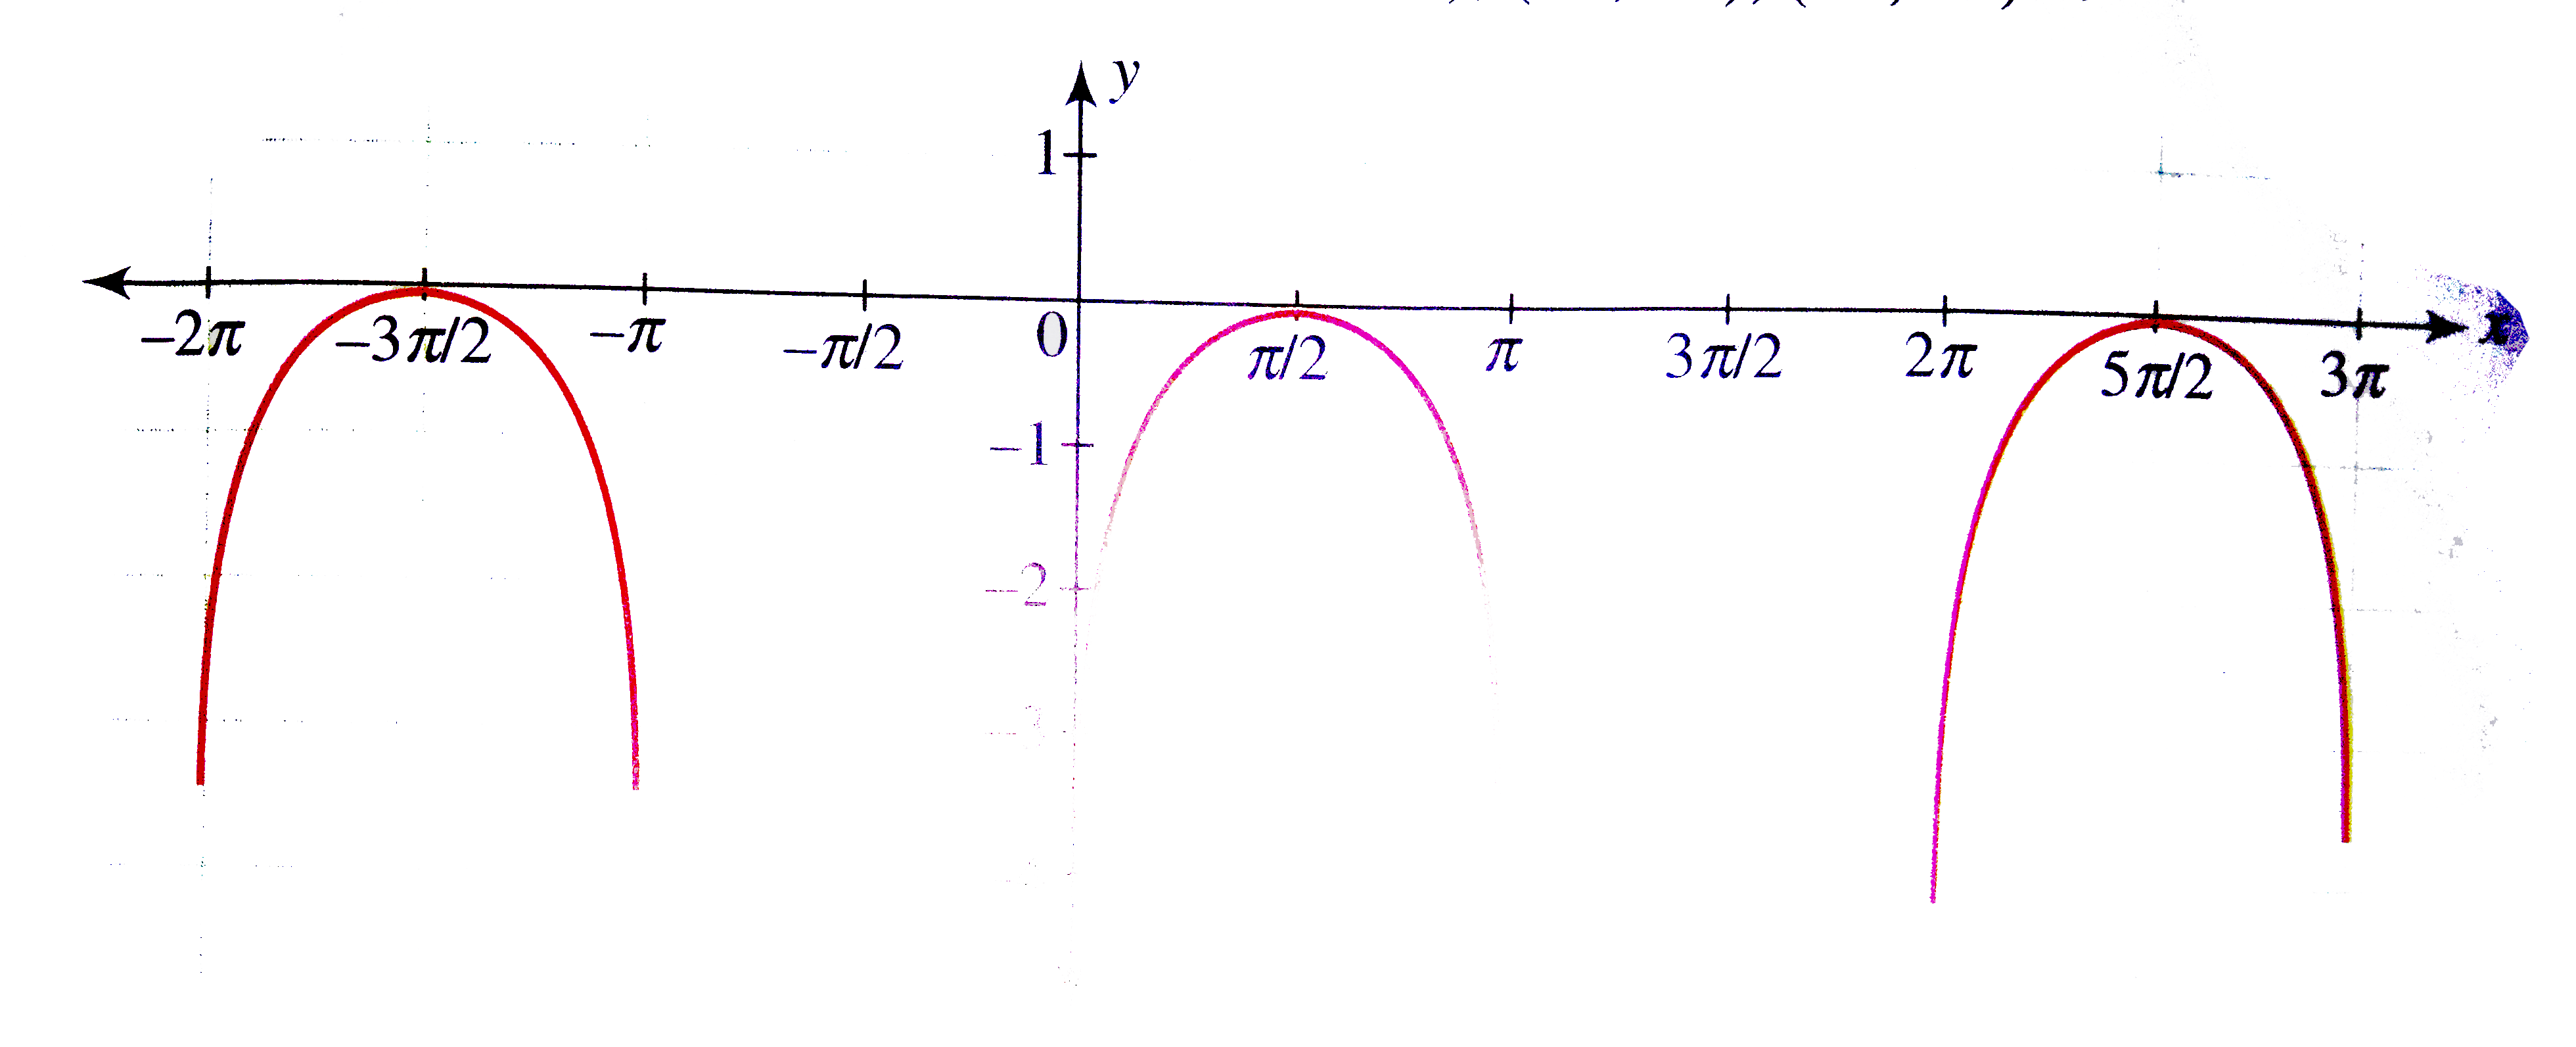
|
|