Saved Bookmarks
| 1. |
Plot a graph showing the variation of coulomb force (F)versus ((1)/(r^(2)))where r is the distancebetween the two charges of each pair of charges:(1 mu C ,2 muC ) and ( 2 mu C ,-3muC ) .Interpret the graphs obtained. |
|
Answer» Solution :Force between two charges `q_1mu C 1 XX 10^(-6) C and q_2 =2 muC = 2xx10 ^(-6) C ` separated by a distance r, ` F= (1)/( 4pi in _0).(q_1q_2)/(r^(2)) = ( 9xx 10 ^(9) xx1xx 10 ^(-6) xx 2xx 10^(-6))/( r^(2)) =(18xx10^(-3))/(r^(2)) N` and force between two charges `q_1.=2 muC =2 xx 10 ^(-6) C and q_2. =-3muC =-3xx 10 ^(-6) `C separated by a distance r, the force `F. =(1)/(4piin _0) .(q_1.q_2.)/(r^(2)) =(9xx 10 ^(9) xx (2xx10^(-6))xx (-3xx10^(-6)))/(r^(2))` `"" =(54 xx 10^(-3))/(r^(2)) N` Graph SHOWING variation of force F and F. VERSUS `(1)/(r^(2)) ` is shown in adjoining From the graph we note following points: (i) Both the graphs are straight line graphs. As force F is repulsive, its graph is in 1st quadrant. But force F. is attractive and the graph is in 4th quadrant. (II) ` As |oversetto F| =3 |oversetto F| , ` hence slope of F `-(1)/(r^(2)) ` graph for second pair of charges is 3 times as compared to that for first pair of charges. 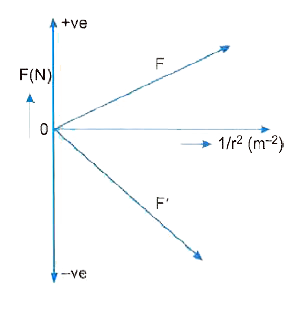
|
|