Saved Bookmarks
| 1. |
The following table depicts the production possibilities of commondiaties X and Y: (a) Show these production possibilities through PPF. What do the points on the curve indicate? (b) Lable a point F inside the curve. What does this point indicate? (c ) Lable a point G outside the curve. What does this point indicate? (d) What must occur so that economy can attain the level of production as indicated by point G. |
|
Answer» Solution :(a)The GIVEN DIAGRAM shows all the PRODUCTION possibilities given in the table. Point on the curve (A to E) indicate that there is fuller utilization of resources, (b) Point F inside the curve indicates under utilization of resources, (c ) Point G outside to curve indicates an unattainable combination, (d) Economy can attain the level of production as indicated by point G, only when there is an INCREASE in resources or an improvement in technology with respect to both COMMODITIES X and Y. 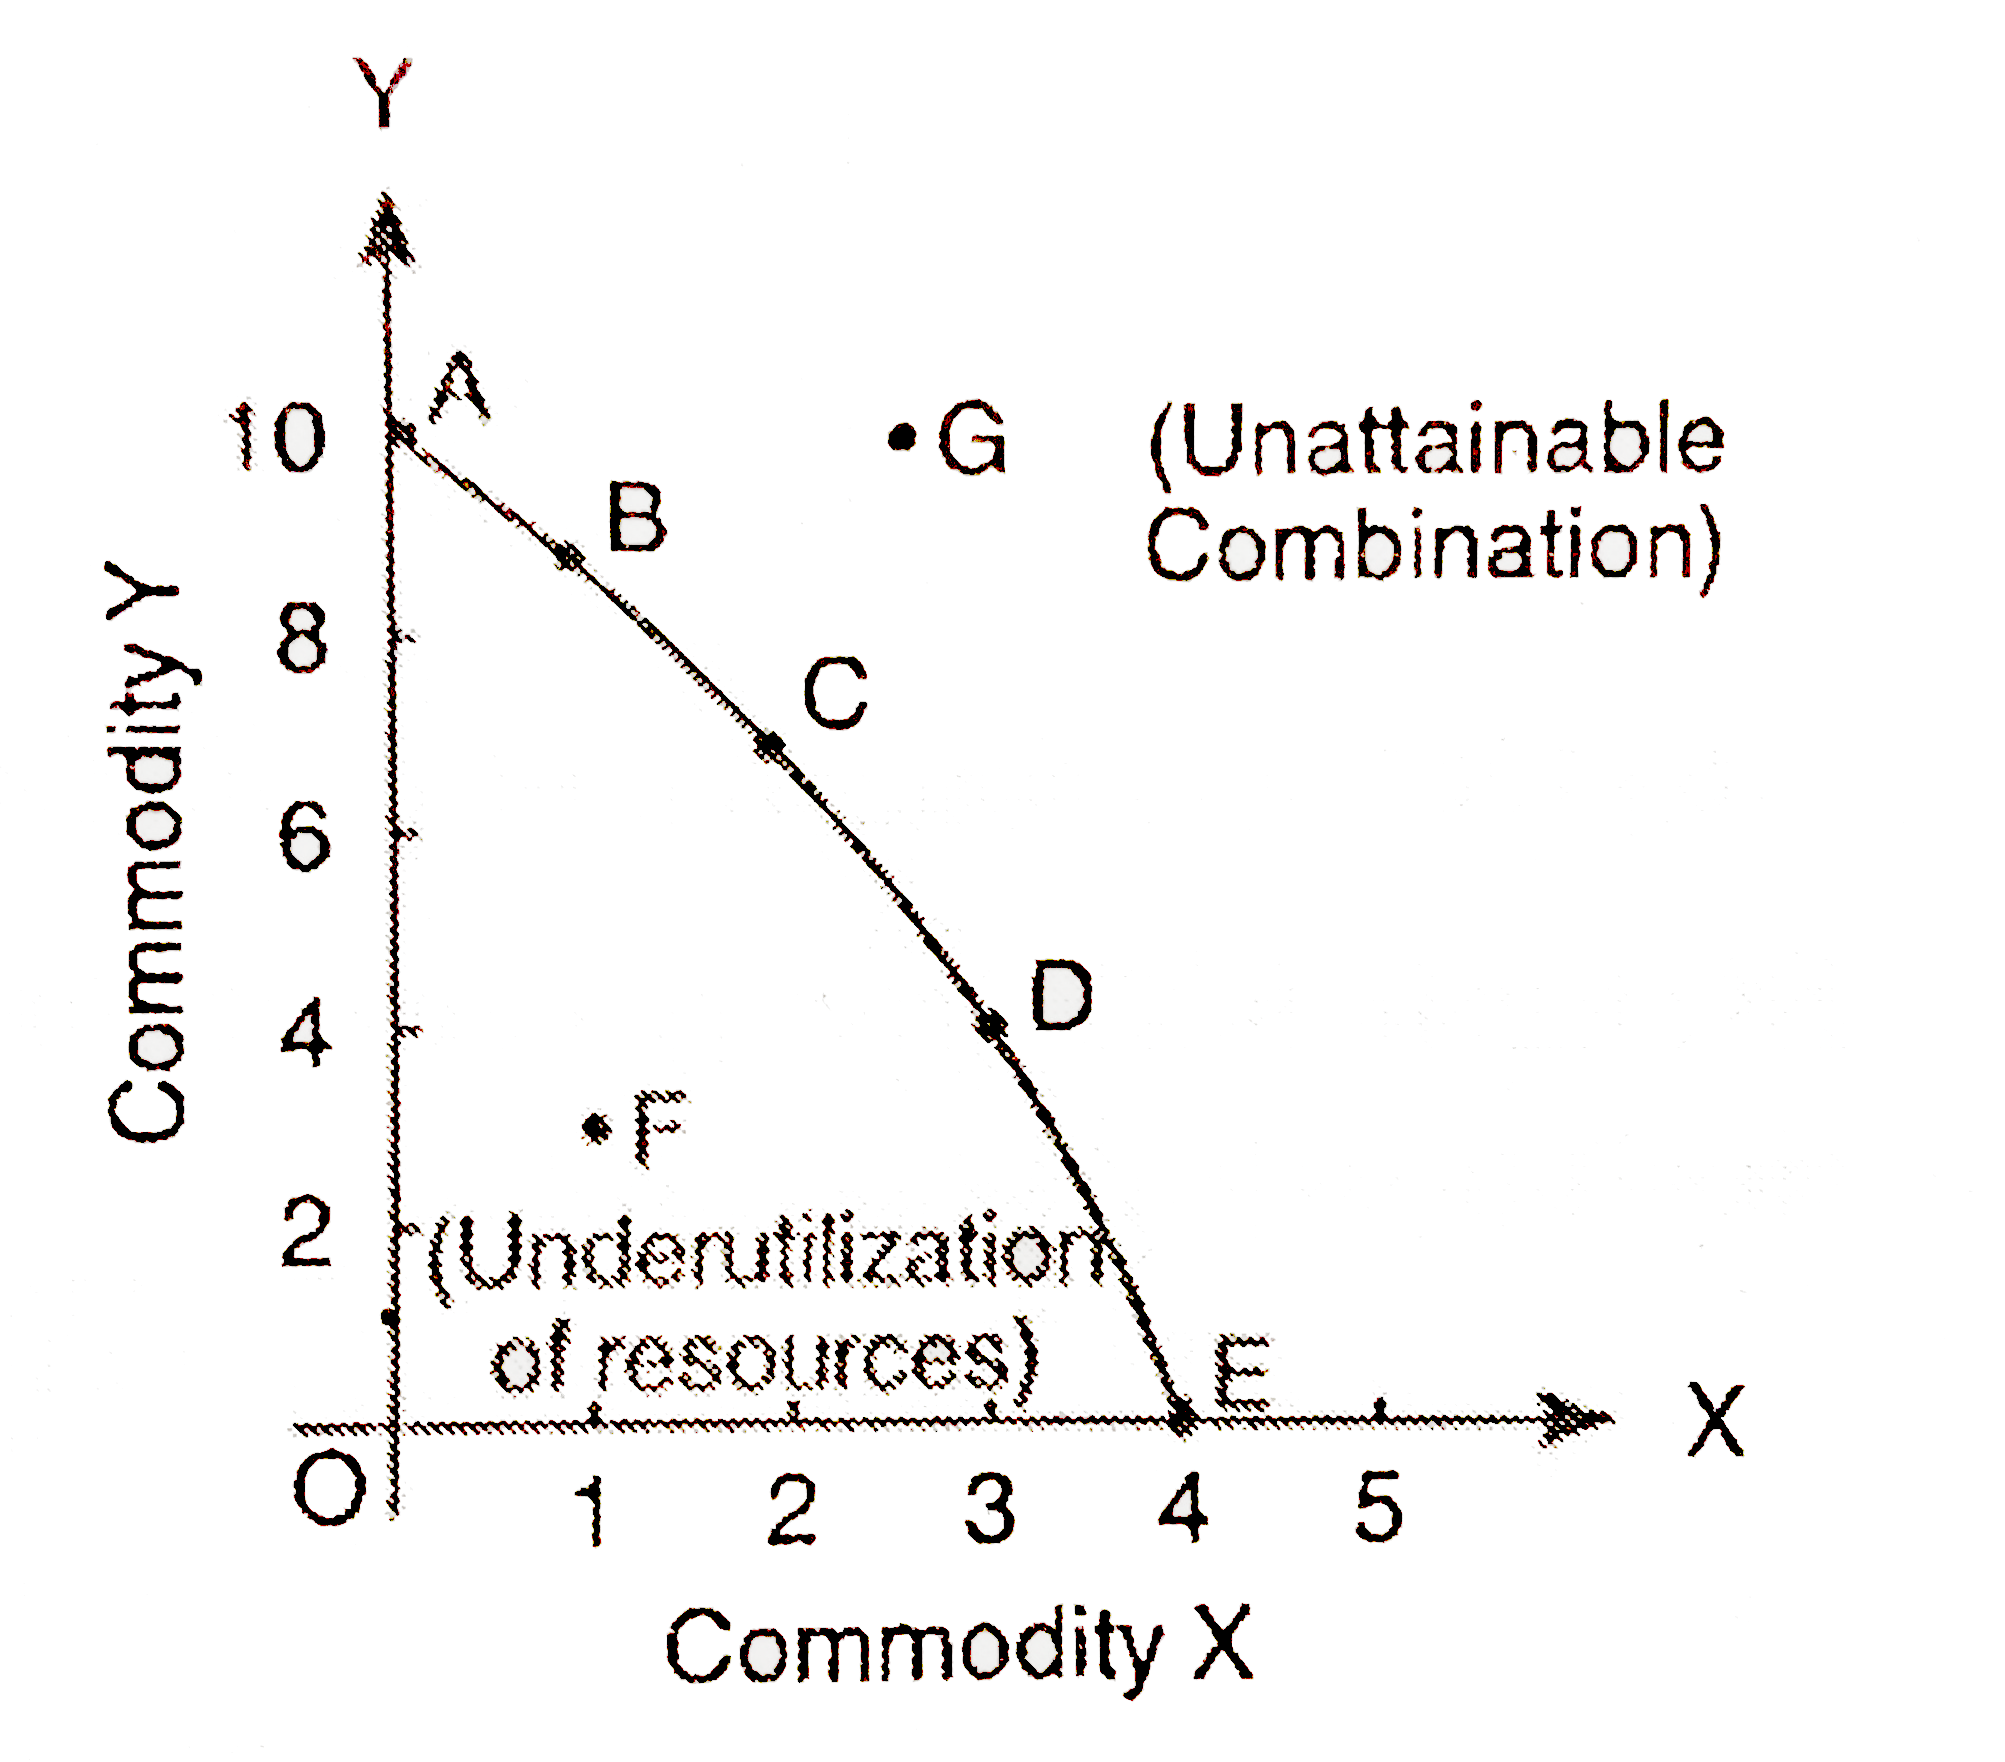
|
|