Saved Bookmarks
| 1. |
The following tables gives height nad weight of the students of a class. Make a scattered diagram to show if the relationship is positive or negative and if the relationship is strong or weak. |
Answer» Solution :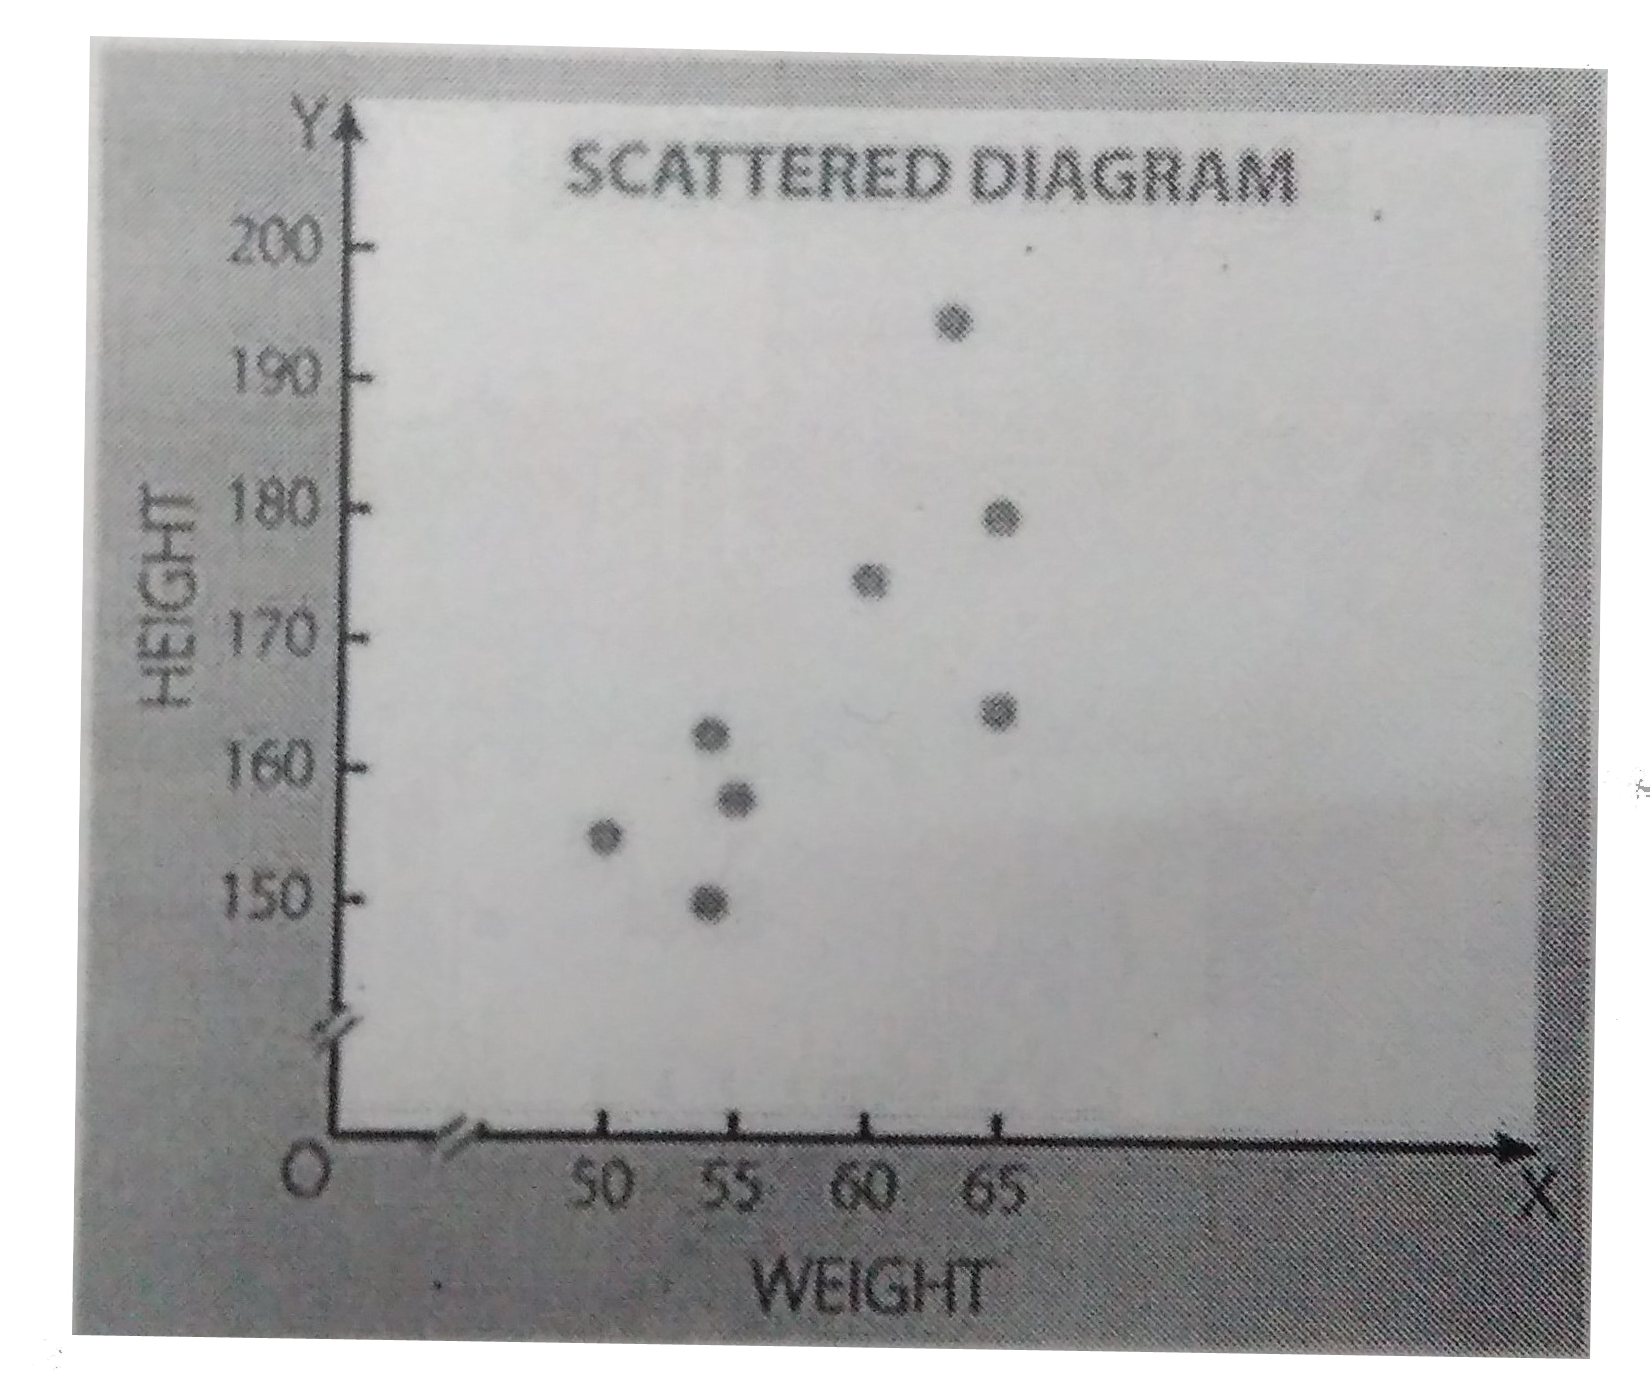 A glance at the above diagram shows that there is positive RELATIONSHIP between height and weight of the students. The dots are moving upward in a paticular course from left to right. It shows that with the INCREASEIN height, weight alos increase. HOWEVER, this is a case of limited positvie correlation, because the dots do not make any straight LINE |
|