

Saved Bookmarks
| 1. |
The velocity -time graph for a vehicle is shown in thefigure . Draw acceleration-time graph from it |
|
Answer» Solution :In time 0 to 2.5 s , ACCELERATION of the VEHICLE, a = slope of OA `= (20-0)/(2.5-0) = 8 ms^(-2)` In time 2.5 to 5s, velocity of the vehicle is uniform . So acceleration = 0 In time 5 to 7s , acceleration of the vehicle, a = slope of BC`= (0-20)/(7 -5)` `= - 10 ms^(-2)` Hence the acceleration-time graph will be as SHOWN in the figure . 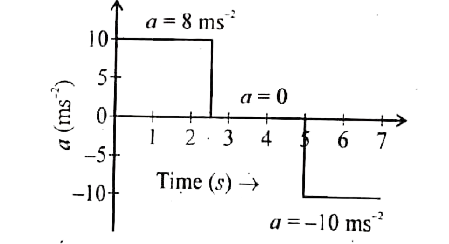
|
|