Saved Bookmarks
| 1. |
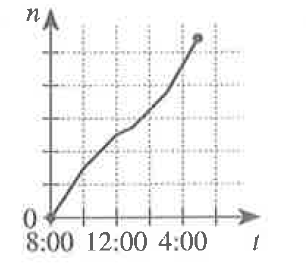
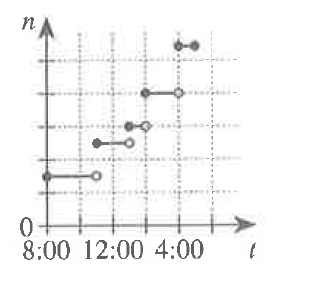
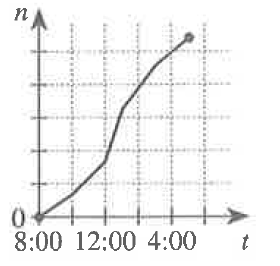
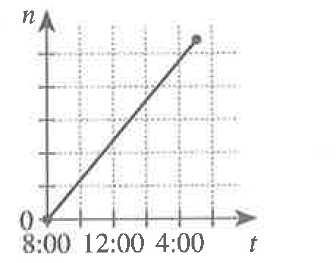
Three copy machines- A,B and C- copy at the same rate and will all be used to make copies of a report. At 8:00 a.m., all 3 machines begin copying Machine A breaks down at 10:00 a.m. And is back in service at 1:00 p.m. Machine B breaks down at 12:00 p.m. (noon) and begins copying again at 3:00 p.m. All 3 machines finish copying at 5:00 p.m. when the copying of the report is complete. One of the following graphs showns n, the numbers of copies made, as a function of t, the time at any given point during the copying. Which graph is it? |
|
Answer»
|
|
Discussion
No Comment Found
Related InterviewSolutions
- P (-2,-1) and (0,-3) are the limiting points of a coaxial system of whichC -= x^(2) + y^(2)+ 5x + y + 4 = 0is a member. The circleS -= x^(2) + y^(2) - 4x - 2y - 15 = 0is orthogonal to the circle C . The point where the polar of P cuts the circle S is
- Which of the following is/are discontinous at x = 1 ?
- Write Minors and Cofactors of the elments of following determinants : |{:(1,0,4),(3,5,-1),(0,1,2):}|
- The vertex of the parabola (y-1)^2 =8 (x-1) is at the centre of a circle and the parabola cuts that circle atthe ends of its latusrectum. Then the equation of that circle is
- {{:(5x-3y=10),(6y=kx-42):} In the system of linear equations above, k represents a constant. If the system of equations has no solution, what is the value of 2k?
- f(x) ={{:(1-sqrt(1-x^(2)),if -1lexle1),(1+ log ""(1)/(x), if xgt1):}
- Given that alpha, beta, gamma, delta are in a geometric progression. If alpha, beta are the roots of x^(2)-x+p=0 " and "gamma, delta are the roots of x^(2)-4x+q=0, where p and q are integers, then the ordered pair (p, q) =
- A poor , frustrated artist named Fresco created a plan to make money. He collected trash, repurposed it into sculptures, then asked various celebrities to write and paint on these trash objects, which he then sold on his own as modern high art. The chart below separately showsthe cost and revenue of his plan. The linear cost function, C(x) , represents the total money spent to make and market the art , while the linear revenue function, R(x) , shows the amount of money he has made in sculpture sales. Fresco initially spent money promoting the project in the media . He also had to pay the celebrities to participate . After 6 months , Fresco had created and sold x number of trash sculptures and finally broke even : he hadn't made or lost any money . How many sculptures did Fresco sell in his first 6 months of the project ?
- A poor , frustrated artist named Fresco created a plan to make money. He collected trash, repurposed it into sculptures, then asked various celebrities to write and paint on these trash objects, which he then sold on his own as modern high art. The chart below separately showsthe cost and revenue of his plan. The linear cost function, C(x) , represents the total money spent to make and market the art , while the linear revenue function, R(x) , shows the amount of money he has made in sculpture sales. The cost function in the chart is determined by a constant production cost per sculpture - in this case, the amount Fresco pays each celebrity to participate - as well as a fixed cost , or the initial cost of promoting the project . What is the fixed cost of Fresco's trash sculpture project ?
- An ellipse is incribed in a rectangle and if the angle between the diagonals is tan ^(-1)2sqrt2then e=


