Saved Bookmarks
| 1. |
Vapour pressures of pure acetone and chloroform at 328 K are 741.8 mm Hg and 632.8 mm Hg respectively. Assuming that they form ideal solution over the entire range of composition, plot P_("total") P_("chloroform"), and P_("acetone")as a function of x_("acetone") . The experimental data observed for different compositions of mixture is : Plot this data also on the same graph paper. Indicate whether it has positive deviation or negative deviation from the ideal solution. |
|
Answer» <P> SOLUTION :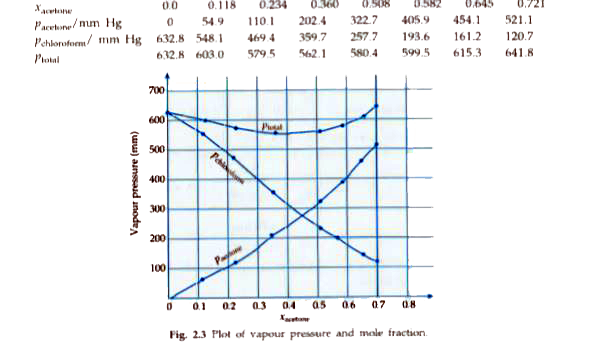 The plot for `P_("TOTAL")`DIPS downwards, hence the solution shows negative deviation from the ideal behaviour. |
|