
Saved Bookmarks
| 1. |
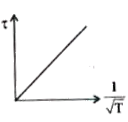
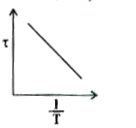
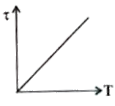
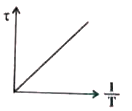
Which graph correctly represents the variation between relaxation time (tau) of gas molecules with absolute temperature (T) of the gas? |
|
Answer»
|
|