Saved Bookmarks
| 1. |
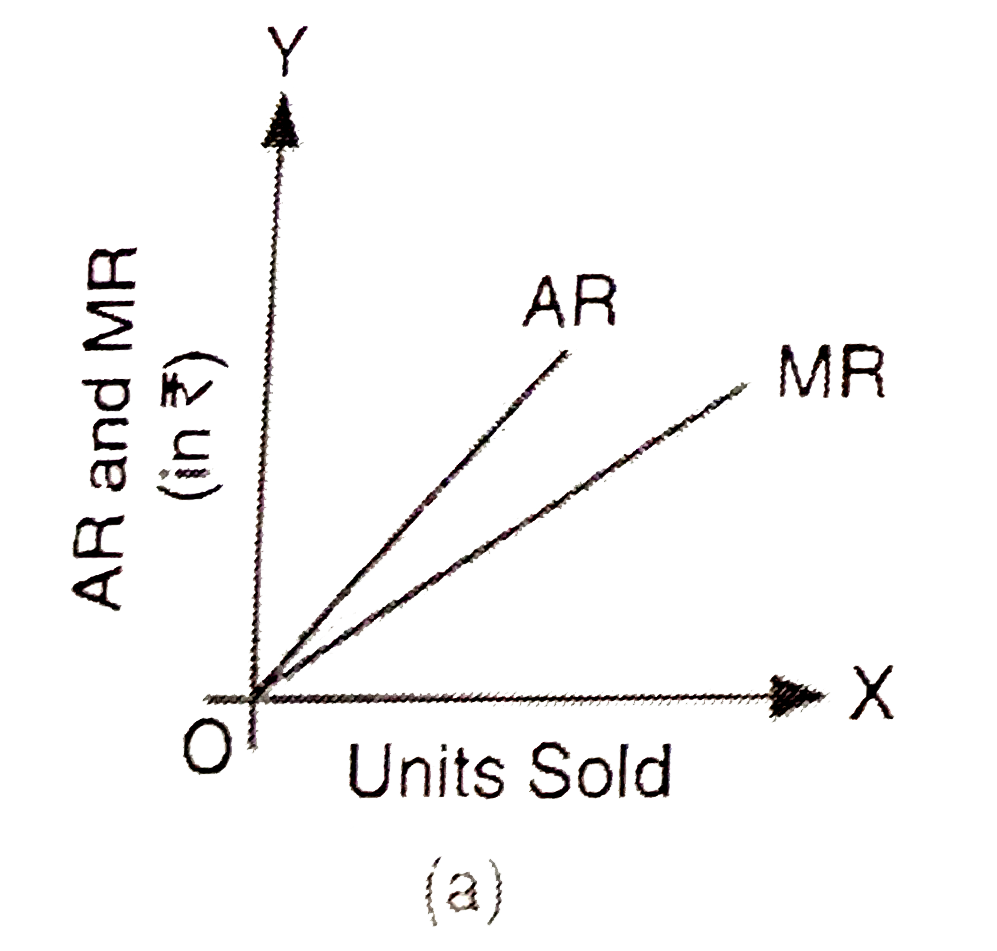
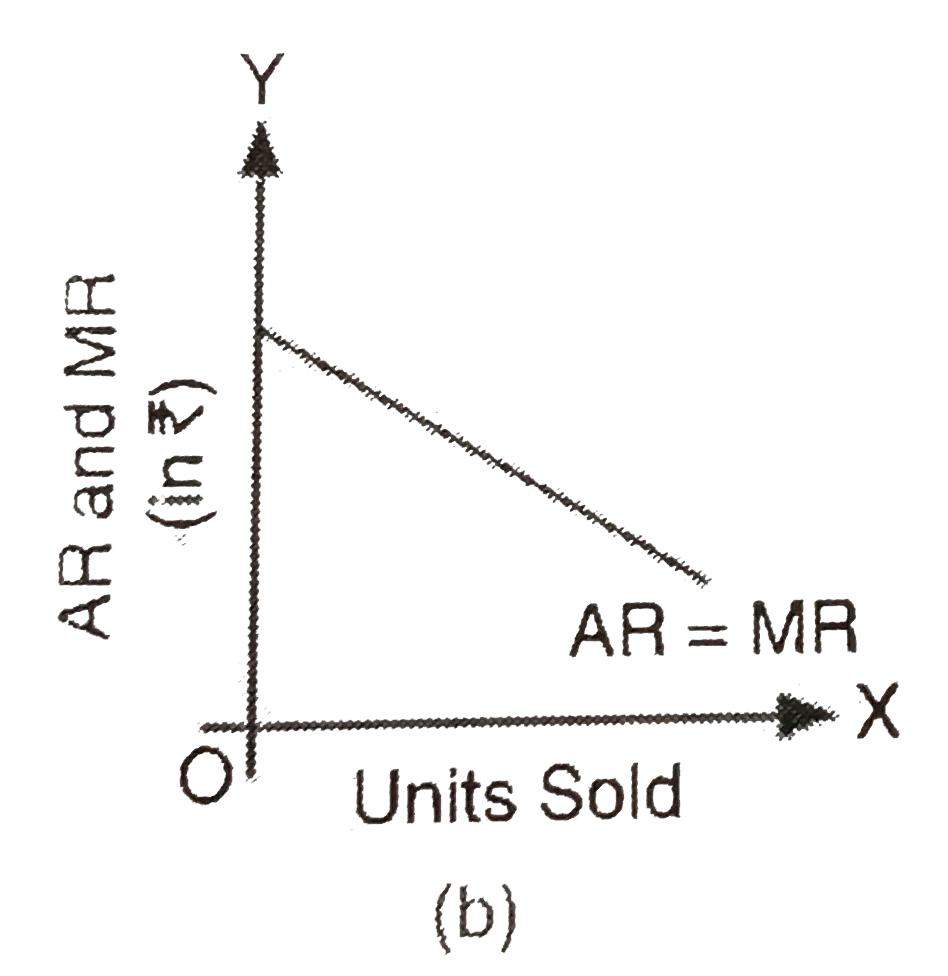
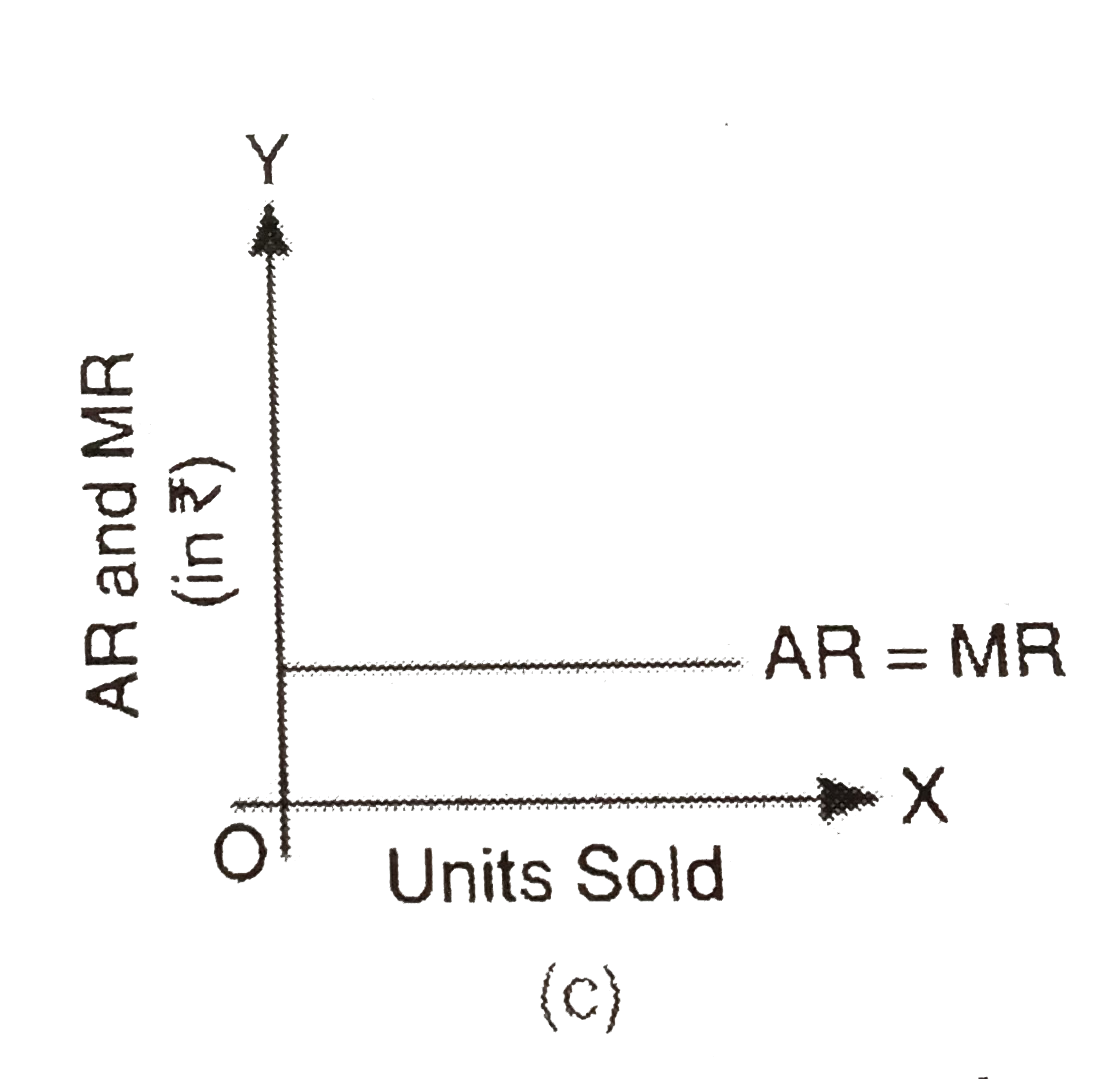
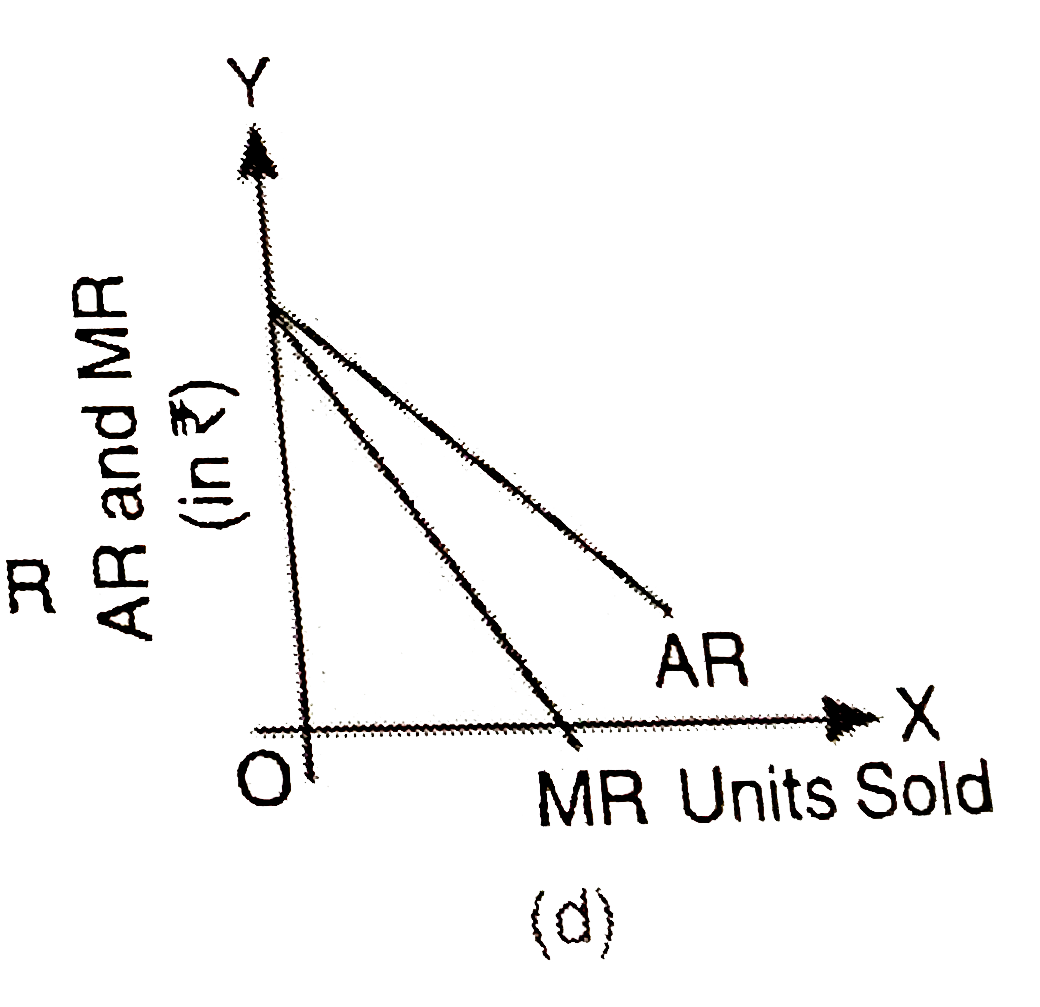
Which of the following diagram correctly depicts the relation between AR and MR when price falls with rise in output ? |
|
Answer»
|
|
Discussion
No Comment Found
Related InterviewSolutions
- Assumption of ordinal apporch
- Critical appraisal of methods of collection of data
- Different between microeconomics and macroeconomics
- What happense when ic slops downwards
- Implications of perfect competition in forms of market
- If price of mango rises demand will ?
- What is statistical table? Explain briefly tha main characteristics of a good statistical table.
- What is production possibility curve
- Explain any three factor which affect the supply of a commodity
- What do you understand by the increasing returns to scale


