Saved Bookmarks
| 1. |
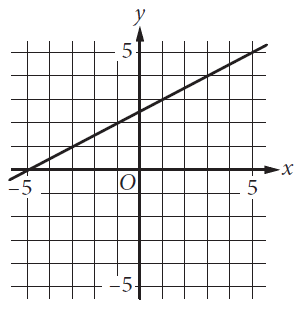
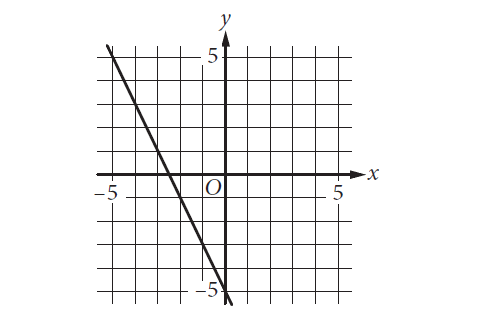
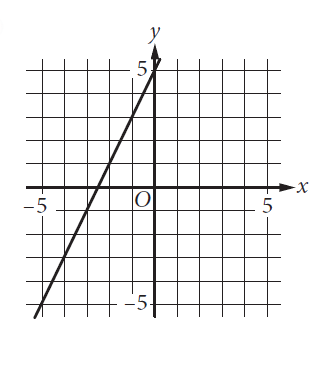
Which of the following is the graph of the equation y = 2x − 5 in the xy-plane? |
|
Answer»
Choices A, B, and C are incorrect. The graph of y = 2x − 5 in the xy-plane is a line with slope 2 and a y-intercept at (0, −5). The graph in choice A crosses the y-axis at the point (0, 2.5), not (0, −5), and it has a slope of `1/2`, not 2. The graph in choice B crosses the y-axis at (0, −5), however, the slope of this line is −2, not 2. The graph in choice C has a slope of 2, however, the graph crosses the y-axis at (0, 5), not (0, −5). |
|