Home
About Us
Contact Us
Bookmark
Saved Bookmarks
Current Affairs
General Knowledge
Chemical Engineering
UPSEE
BSNL
ISRO
BITSAT
Amazon
ORACLE
Verbal Ability
→
Class 12
→
Accounts in Class 12
→
A graph showing the variation of volume with tempe...
1.
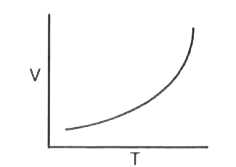
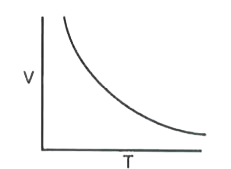
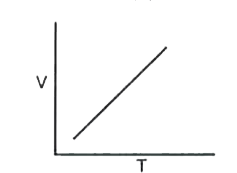
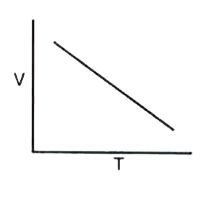
A graph showing the variation of volume with temperture at constant pressure would look like
Answer»
ANSWER
:
C
Show Answer
Discussion
No Comment Found
Post Comment
Related InterviewSolutions
Which of the following compounds is not cleaved by HI even at 525 K ?
To a 25 mL H_(2)O_(2) solution excess of an acidified solution of potassium iodide was added. The iodine liberated required 20 " mL of " 0.3 N sodium thiosulphate solution Calculate the volume strength of H_(2)O_(2) solution.
The suggested mechanism of a reaction is : (a) A+BhArrD("fast) "(b)A+Drarr2C("slow")Write the balanced equation of the reaction if its experimentally deduced rate equation is , rate k=[A]^(2)[B] Find the intermediate formed during the course of the reaction . Does the predicted rate law from the mechanism match the experimental rate law ?
Which of these changes with time for a first-order reaction A Rate of reaction B . Rate constant C . Half-life
What is the hybridisation of central atom in the product obtained along with hydrofluoric acid when complete hydrolysis of Xenon Hexa Fluoride takes place ?
Which of the following amino acid forms sulphide bond in polypeptide
Which of following pair is Diastereomers:
What is the major product of the following reaction CH_3C-=C-CH_2-CH_3overset("1 mole of " Cl_2)to
Which polymer is used in petrol tank linings ?
Which of the following carbohydrates are branched polymer of glucose ?
Reply to Comment
×
Name
*
Email
*
Comment
*
Submit Reply
Your experience on this site will be improved by allowing cookies. Read
Cookie Policy
Reject
Allow cookies