Saved Bookmarks
| 1. |
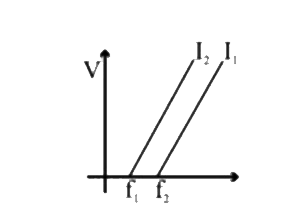
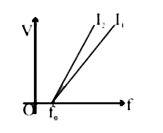
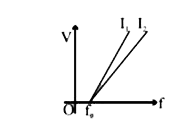
A photoelectric experiment is performed at two different light intensities I_(1) and I_(2) (I_(2) gt I_(1)). Choose the correct graph showing the variation of stopping potential versus frequency of light. |
|
Answer»
|
|