Saved Bookmarks
| 1. |
Consider a radioactive nucleus A which decays to a stable nucleus C through the following sequences: AtoBtoC Here, B is an intermediate nucleus which is also radioactive. Considering that are N_(0) atoms ofA initially, plot the graph showing the variation of number of atoms of A and B versus time. |
|
Answer» Solution :The given sequence of radioactive decay is `AtoBtoC` C is STABLE. At t=0, `N_(A)=N_(0) and N_(B)=0`. As time passes on, t increases.`N_(A)` FALLS of exponentially to zero at `t=oo`. The number of atoms of B goes on increasing with time, becomes maximum and finally decays to zero (at `t=oo`) following exponential decay law. The variation of the number of atoms of A and B versus time is SHOWN in FIG. 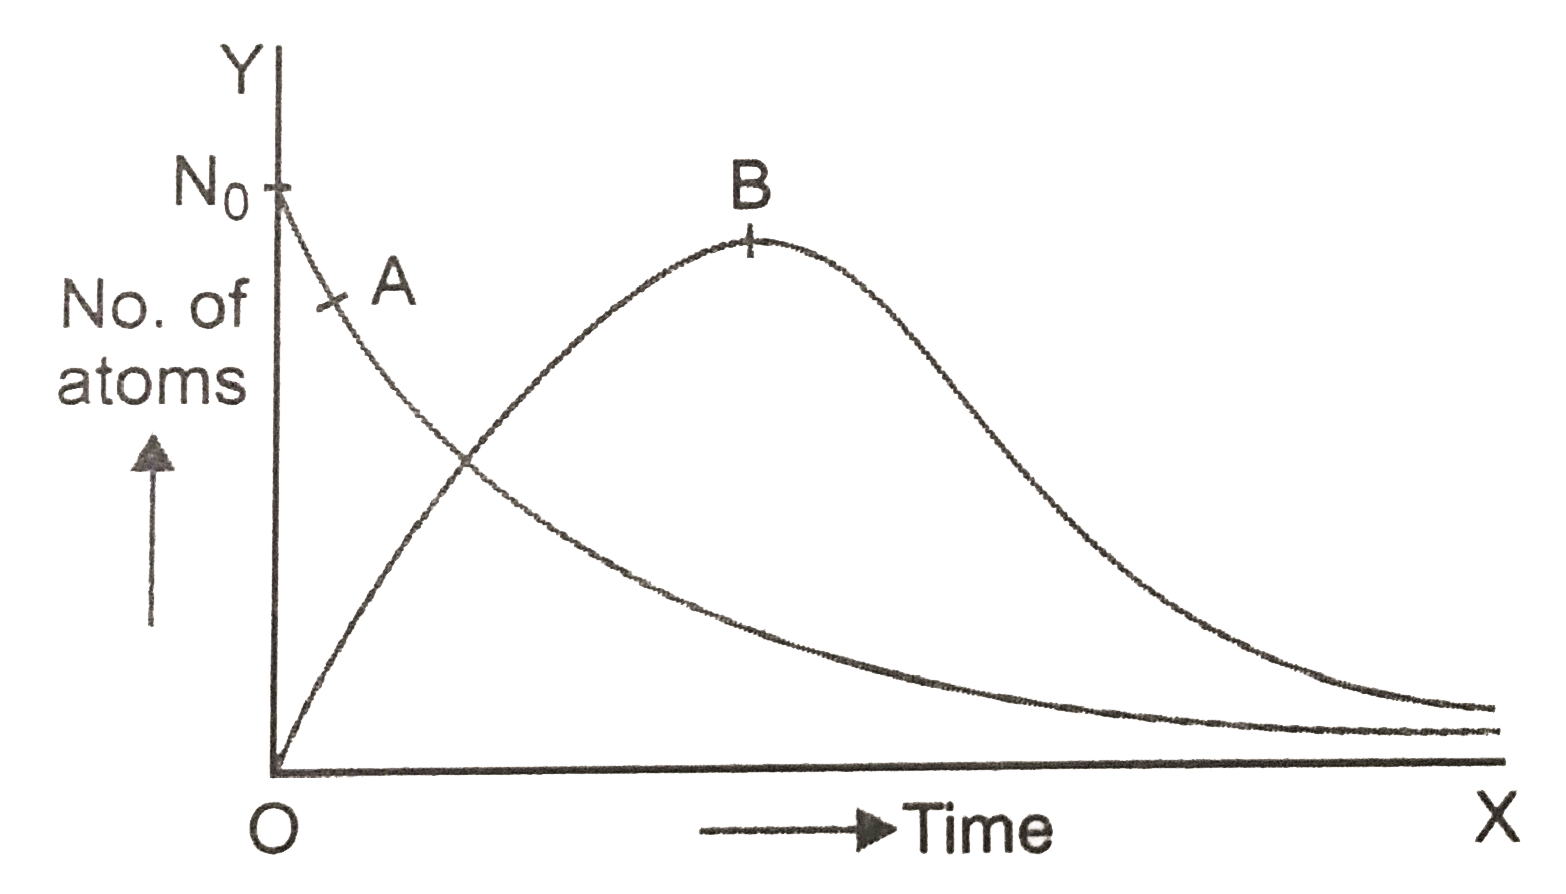
|
|