Saved Bookmarks
| 1. |
Draw the graph showing the variation of intensity of polarised light transmitted by an analyser. |
Answer» SOLUTION :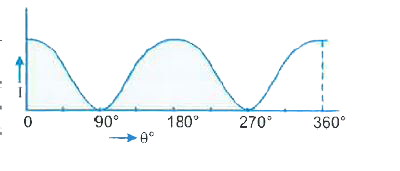
|
|