Saved Bookmarks
| 1. |
Explain graphicalrepresentations of the firstorder reaction. |
|
Answer» Solution :(1) A graph of rateof a reaction andconcentration : The differentialrate law for firstorder reaction, `A to` Products isrepresented as, RATE` = -(d[A])/(dt) = k[A]` `therefore` Rate `= k xx [A]_(t)""(y= mx)` WHENTHE rateof a firstorderreactionis plottedagainst concentration, `[A]_(t)` , a straightlinegraph is OBTAINED. With the increase in the concentration `[A]_(t)`, rate R, increases. The slope of the line gives the value of rate constant k. (2)A graph of concentration against time : When the concentration of the reactant is plotted against time t, a curve is obtained. The concentration `[A]_(t)` ofthereactant decreases exponentiallywith time. The variationin theconcentration can be represented as,`[A]_(t)= [A]_(0) e^(-kt)` where [A], and [A] are initial and final CONCENTRATIONS the reactant and k is the rate constant. The time required to complete the first order reaction is infinity. (3) A graph of half-life period and concentration : The half -lifeperiod `t_(1//2)` of a firstorderreaction is given by `t_(1//2) = (0.693)/(k)` where k is therate constant . Forthe givenreactionat constant temperature , `t_(1//2)`is constant adn independentof the concentrationof thereactant. Hence when a graphof `t_(1//2)` is plottedagainstconcentration, a stringht lineparallel to theconcentrationaxis (slope = zero) is obtained. 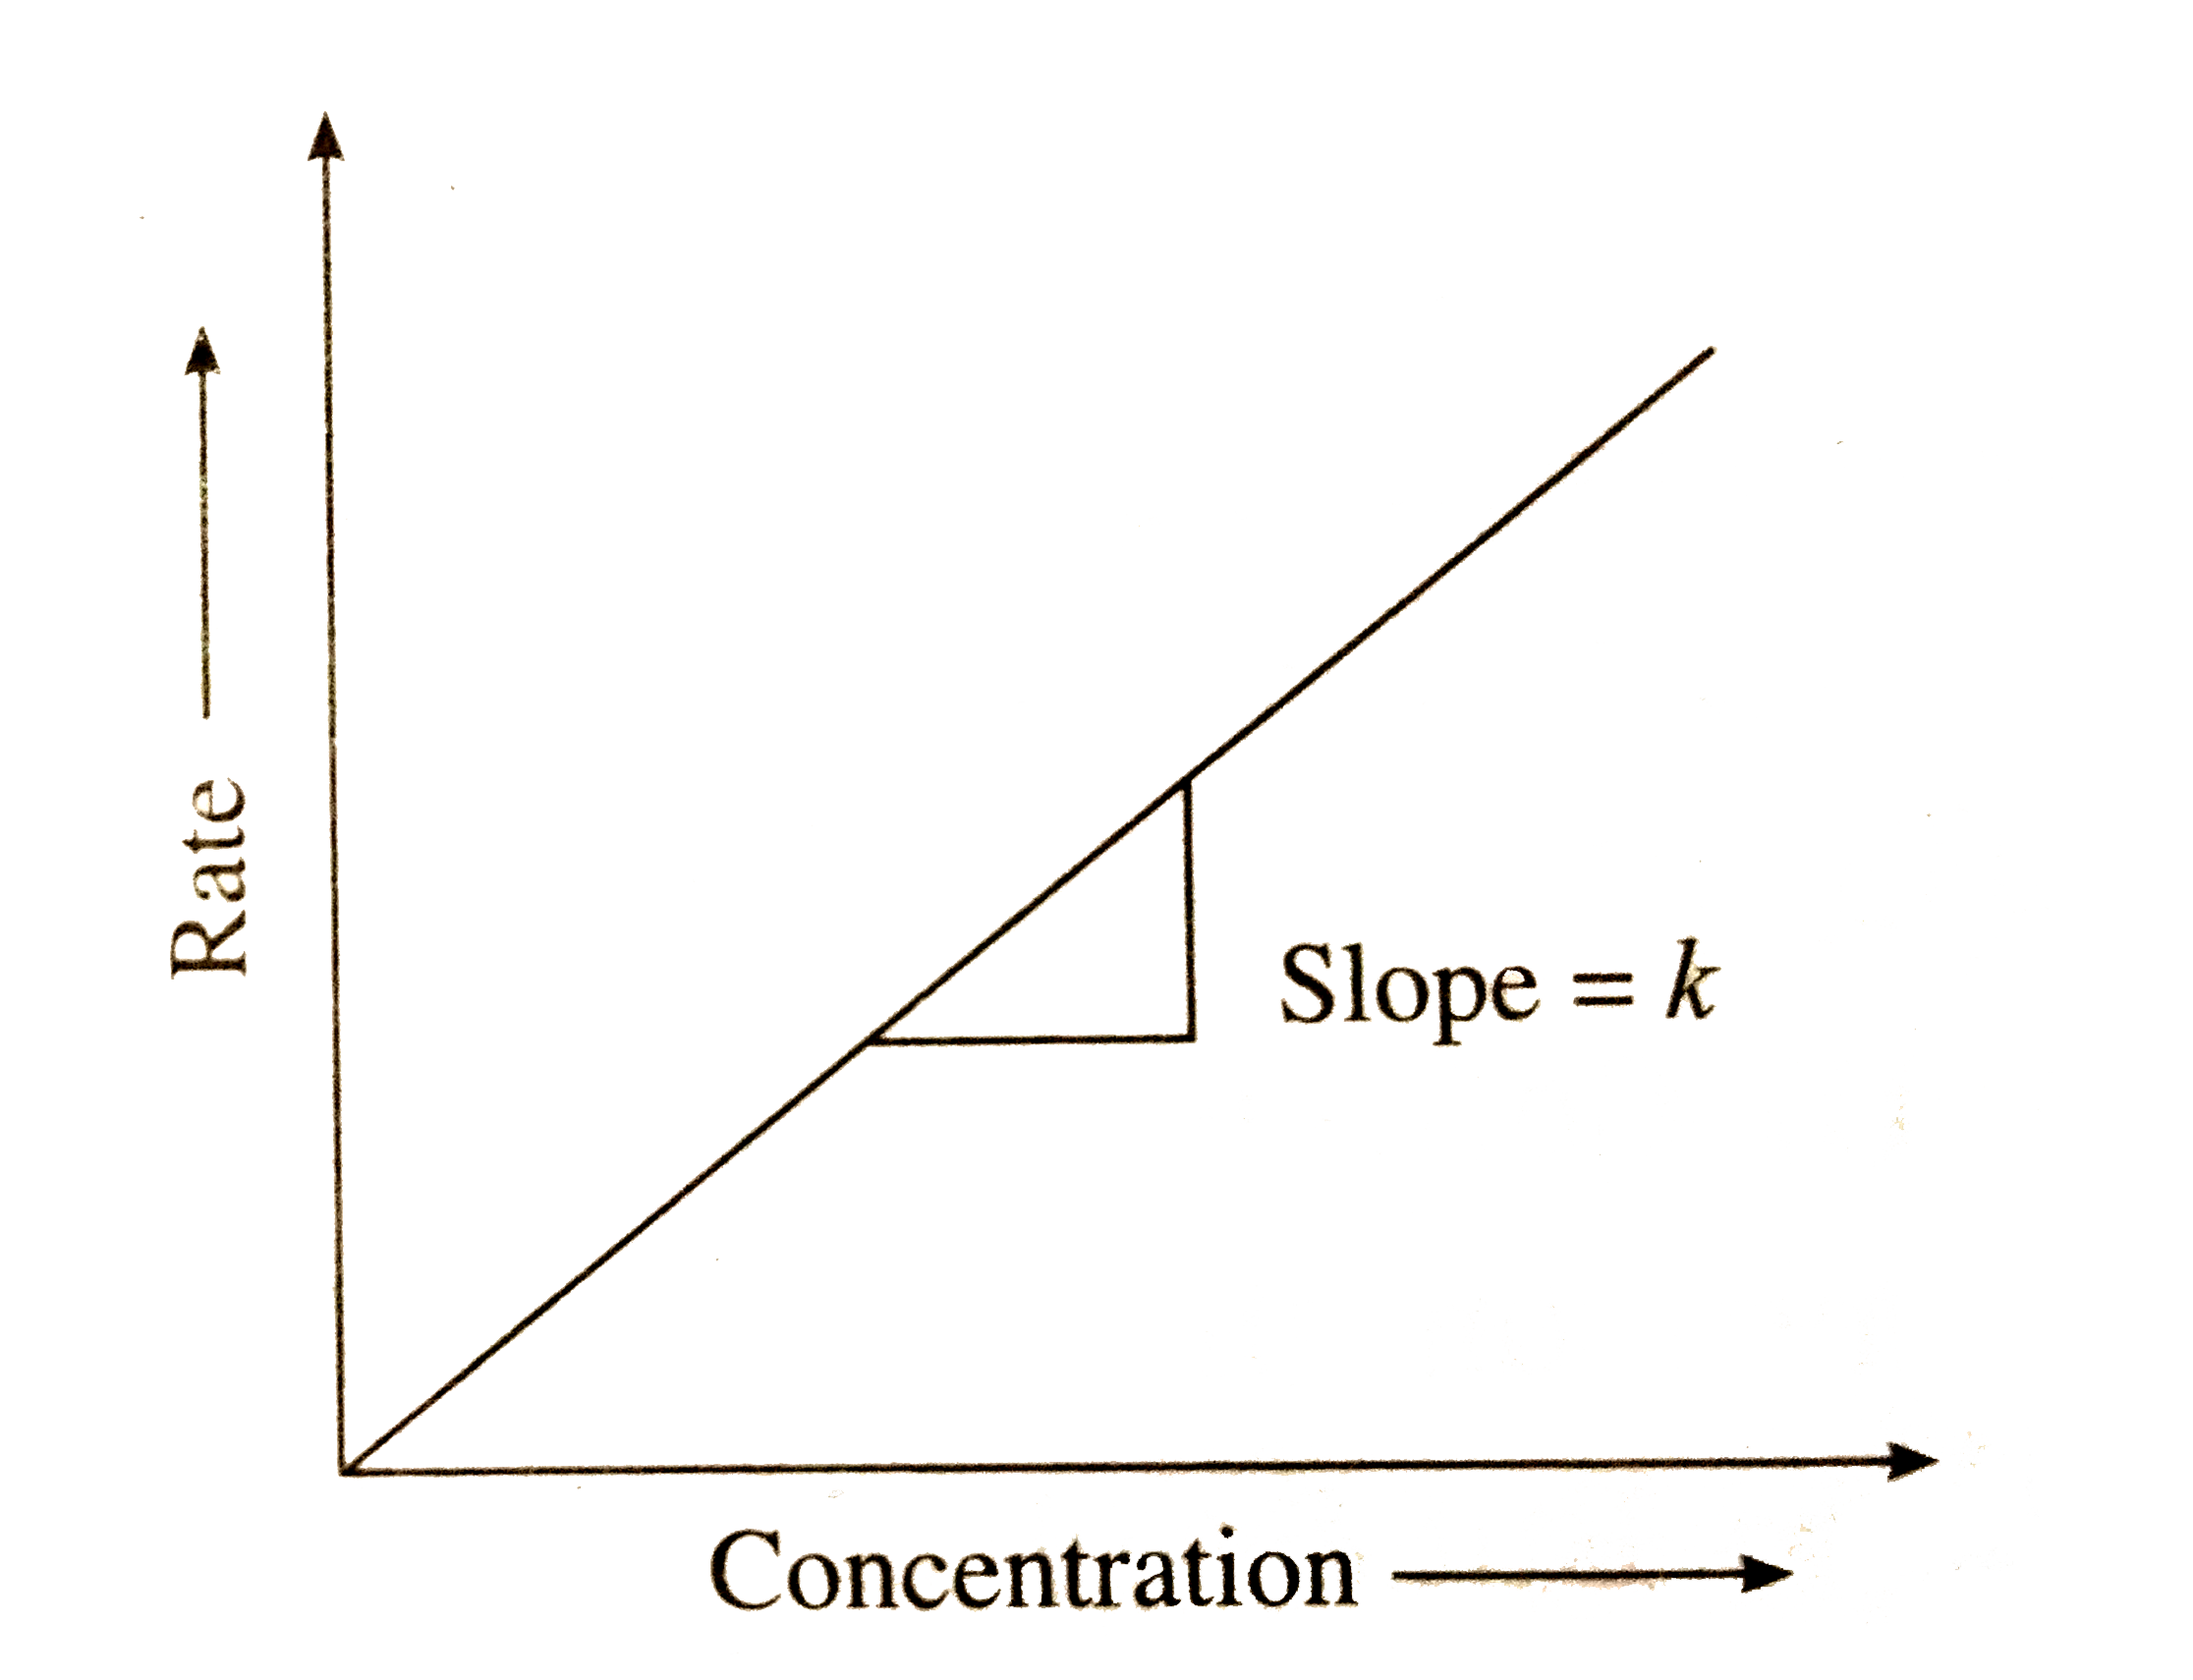 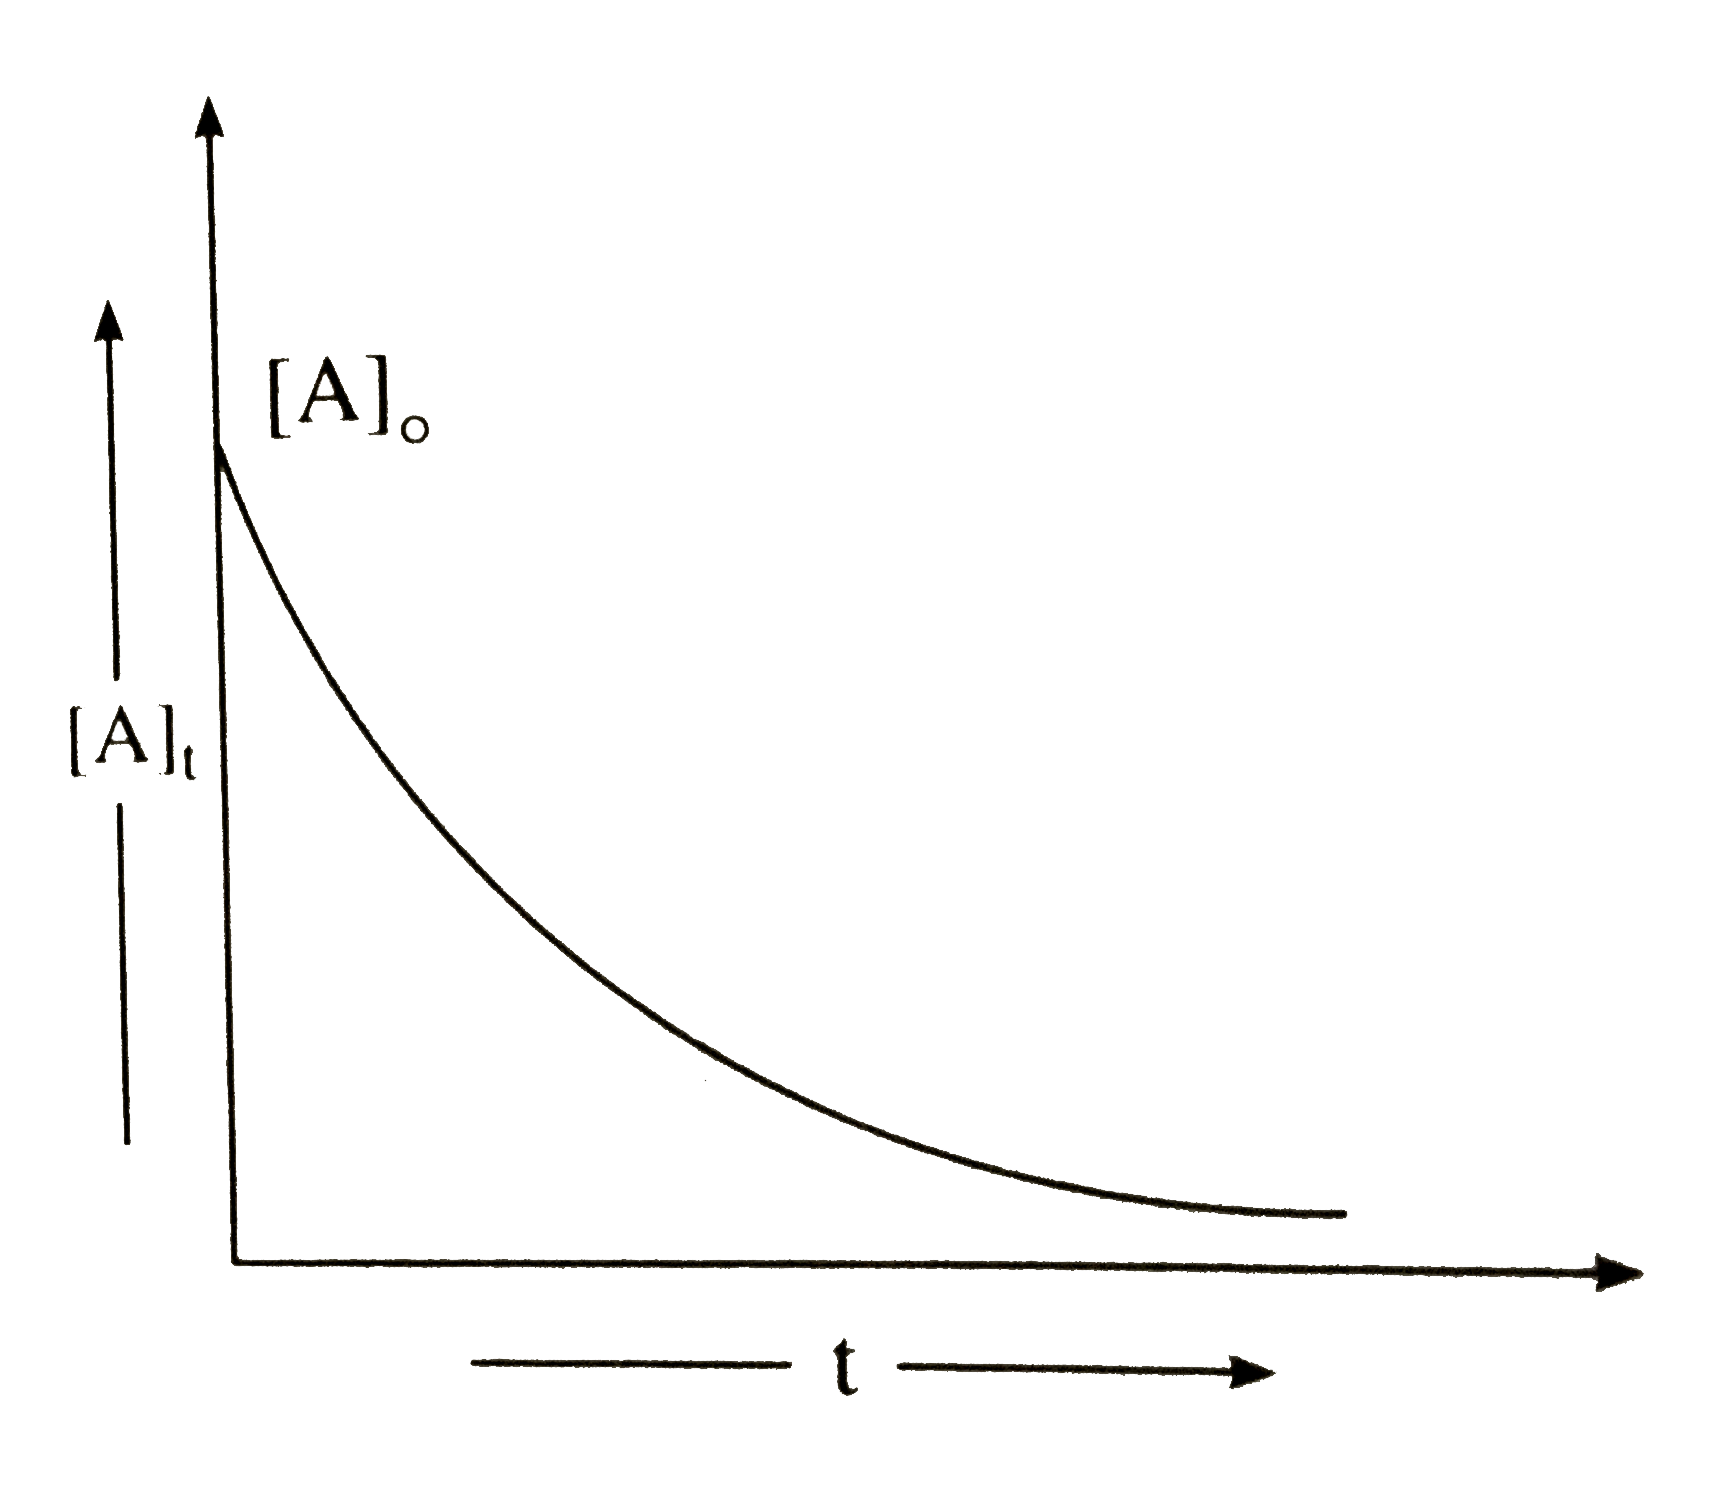 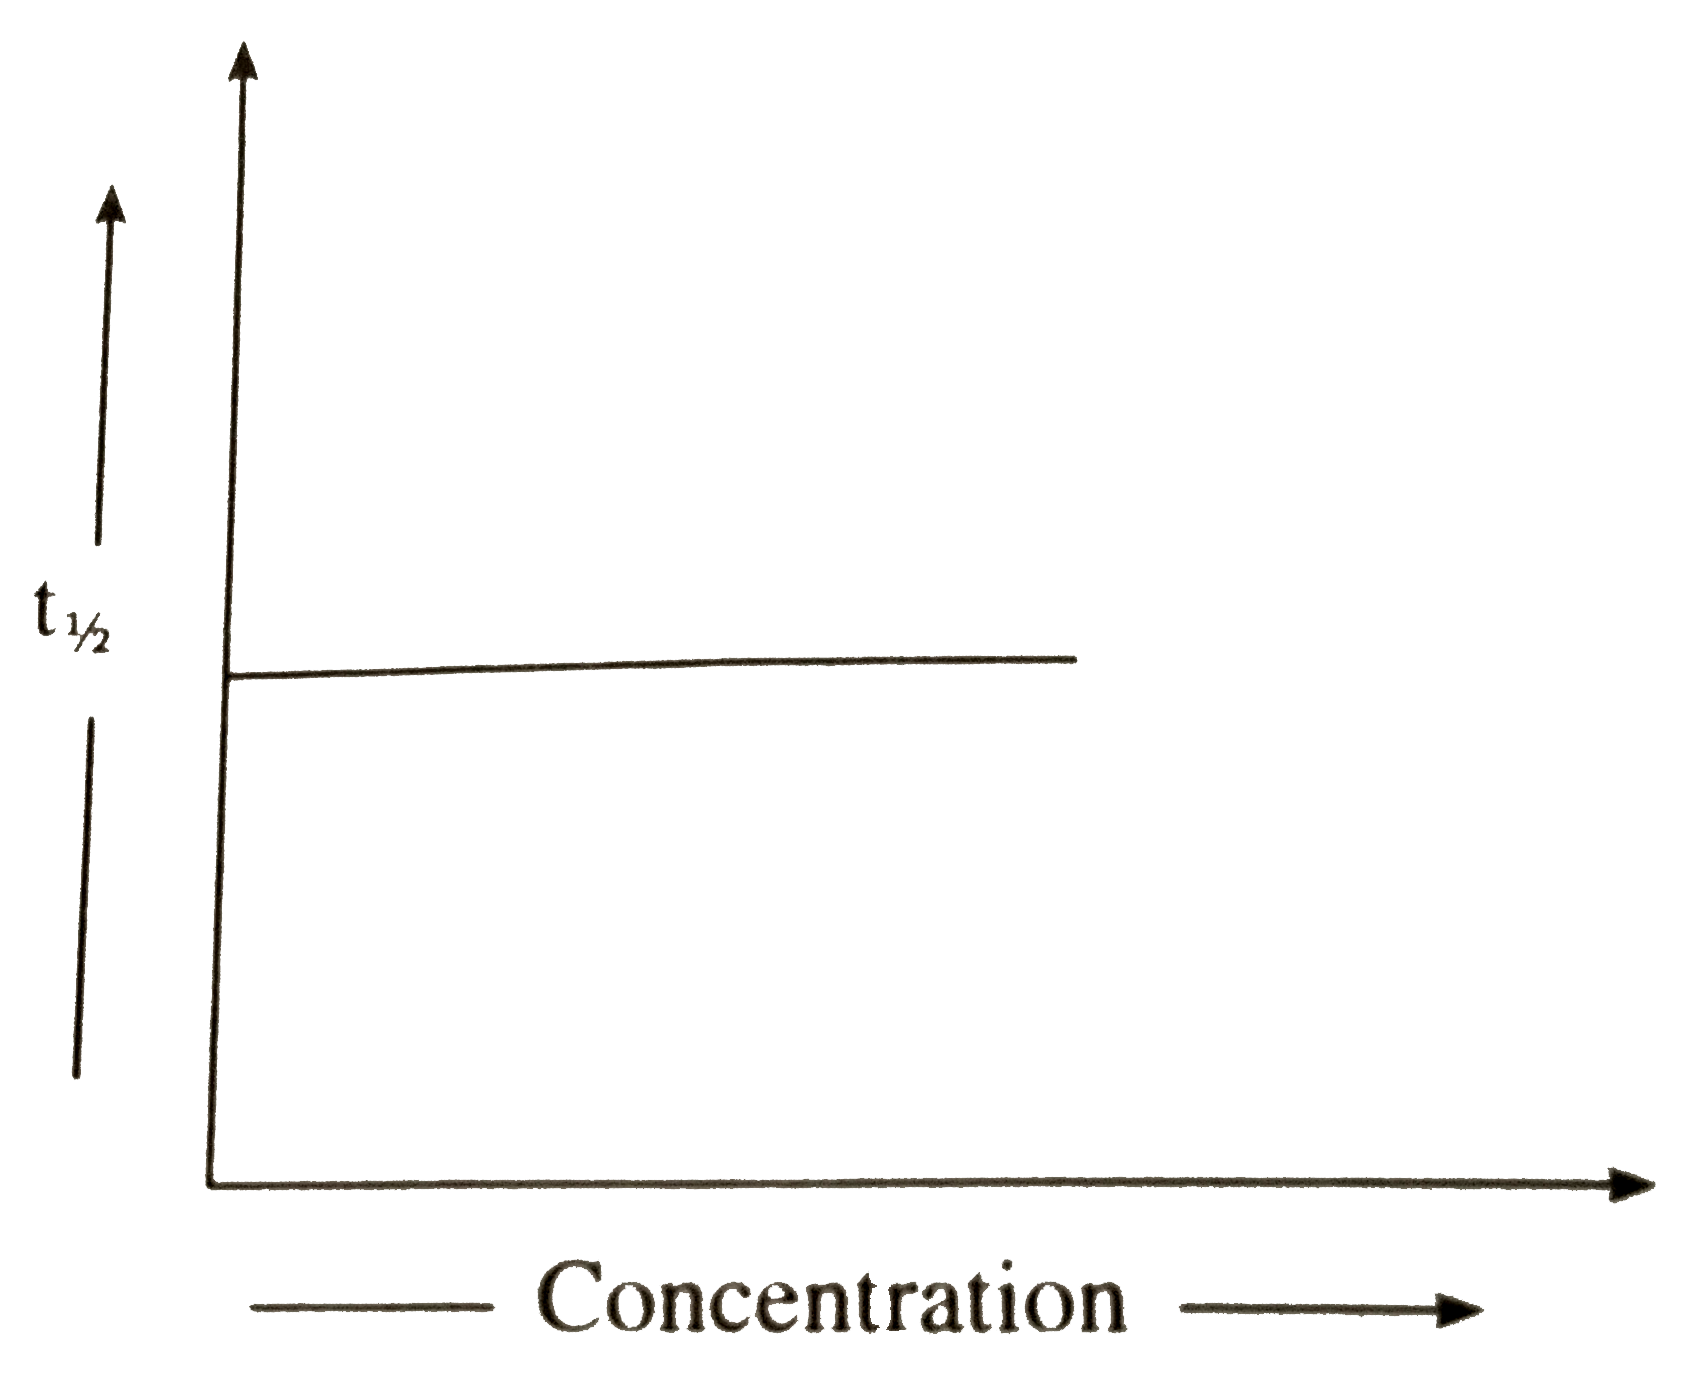
|
|