Saved Bookmarks
| 1. |
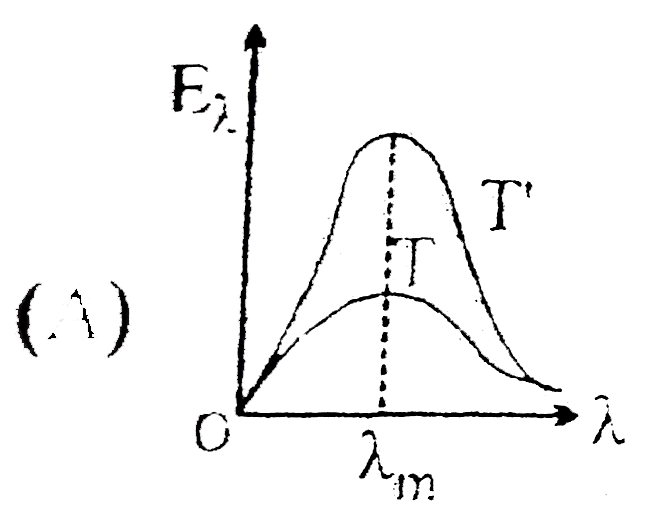
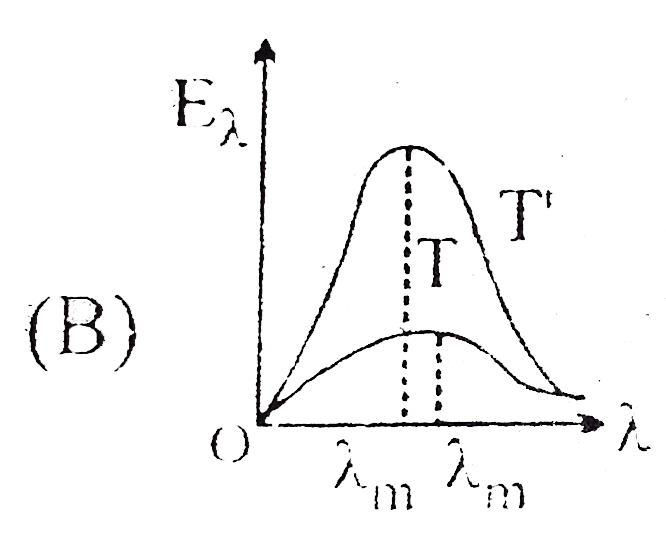
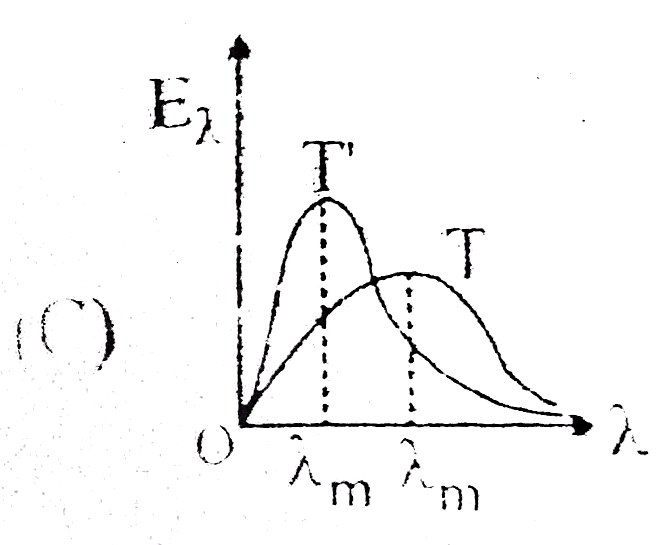
Identify the graph which correctly represents the spectral intensity versus wavelength graph at two temperatures T and T (TleT) |
|
Answer»
|
|