Saved Bookmarks
| 1. |
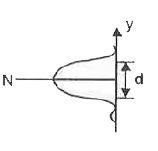
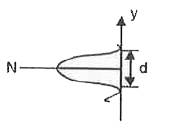
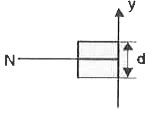
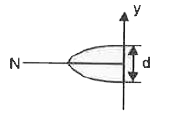
In an experiment, electrons are made to pass through a narrow slit of width d comparable to their de-Brogile wavelength. They are detected on a screen at a distance D from the slit. Which of the following graphs can be expected to represent the number of electrons N detected as a function of the detector position y(y = 0 corresponds to the middle of the slit)? |
|
Answer»
|
|