Saved Bookmarks
| 1. |
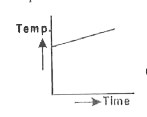
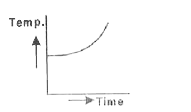
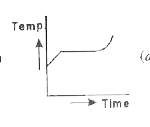
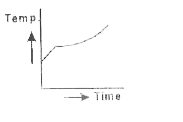
Liquid oxygen at 50 K is heated to 300 K at constant pressure of 1 atm. The rate of heating is constant. Which of the following graphs represents the variation of temperature with time ? |
|
Answer»
|
|