Saved Bookmarks
| 1. |
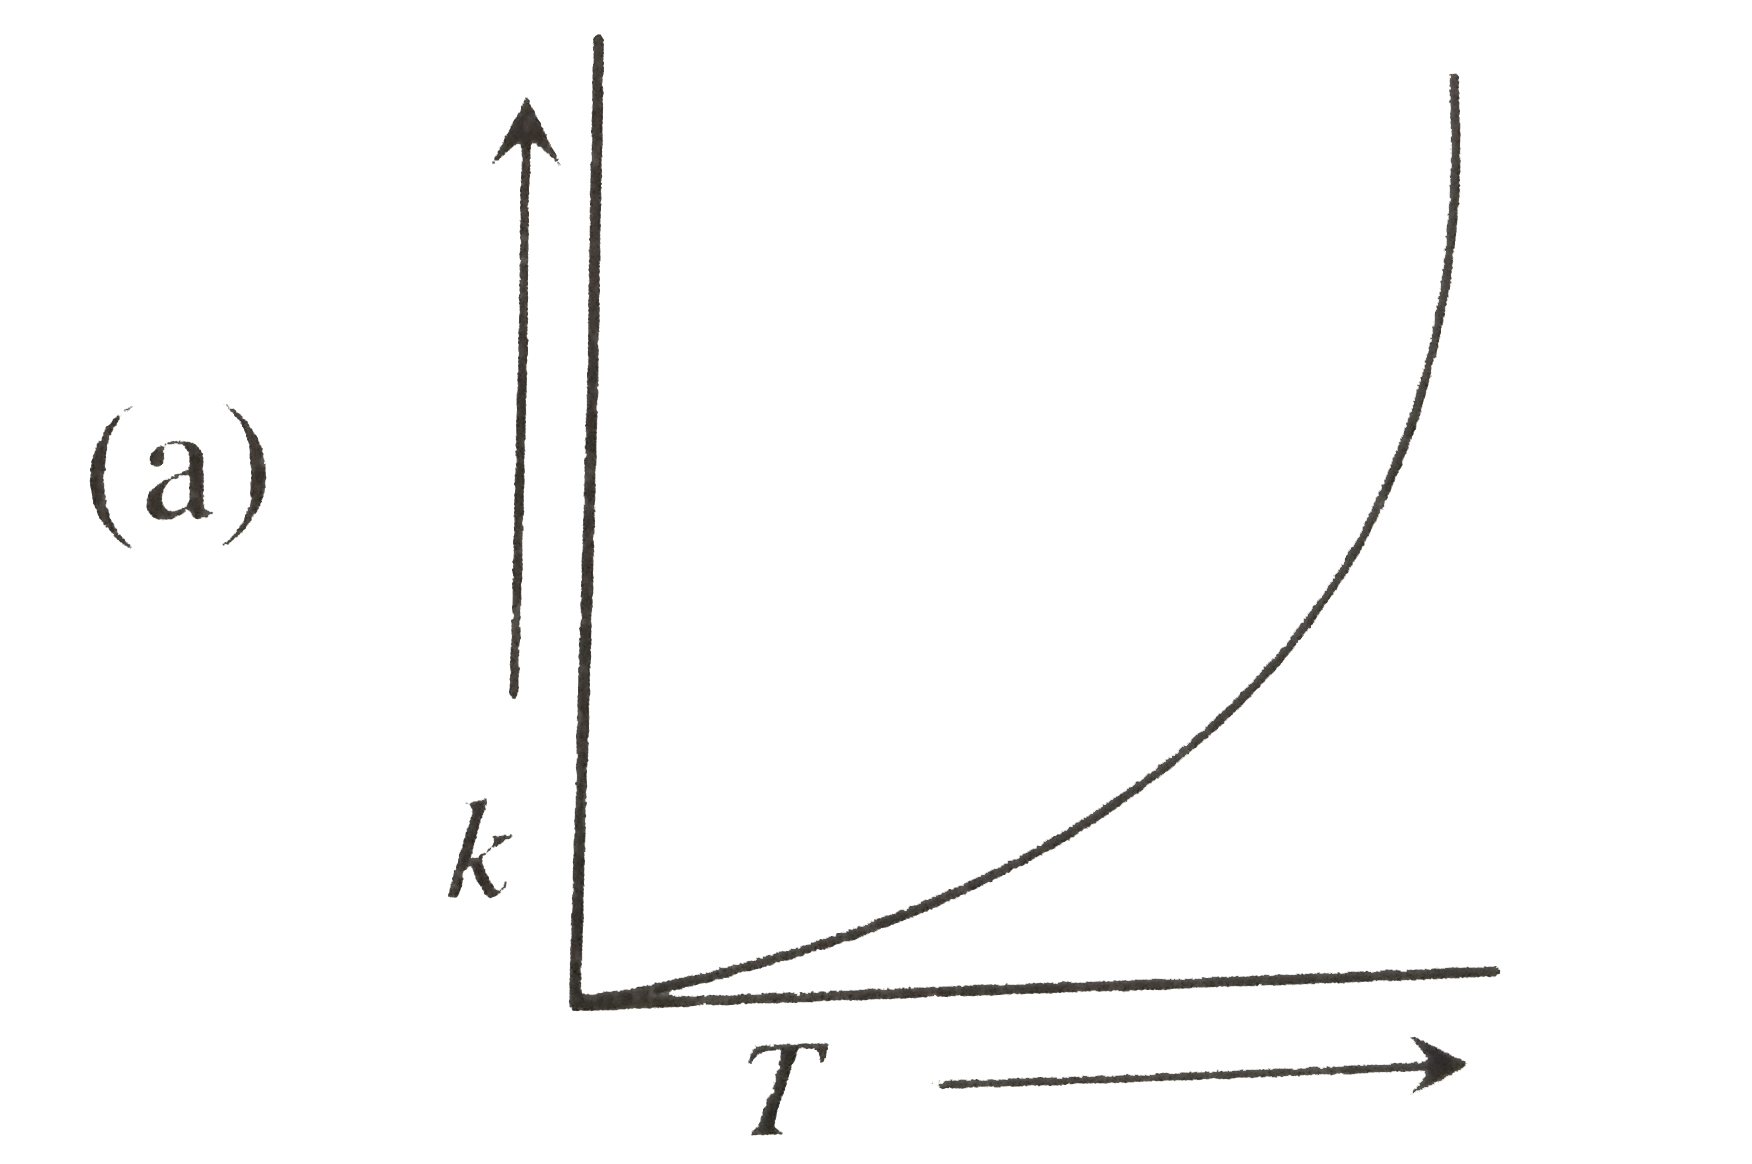
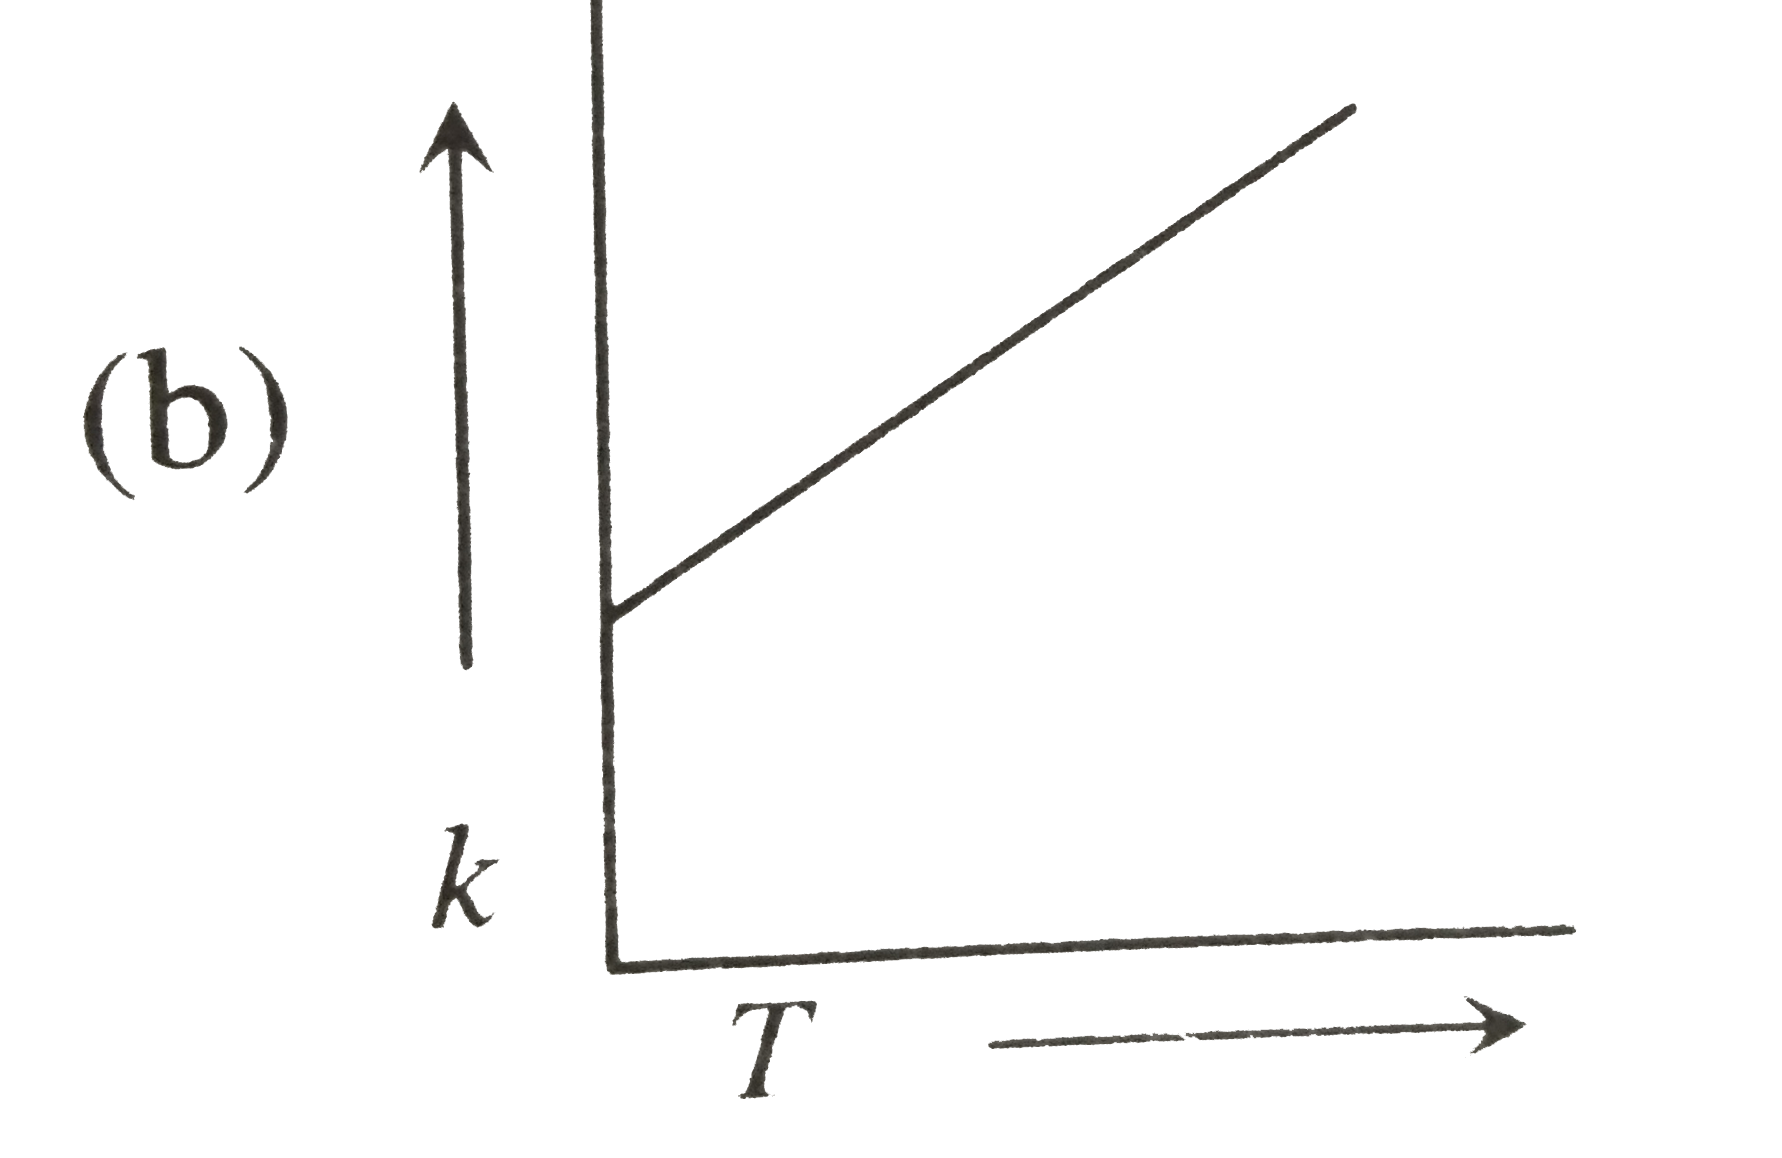
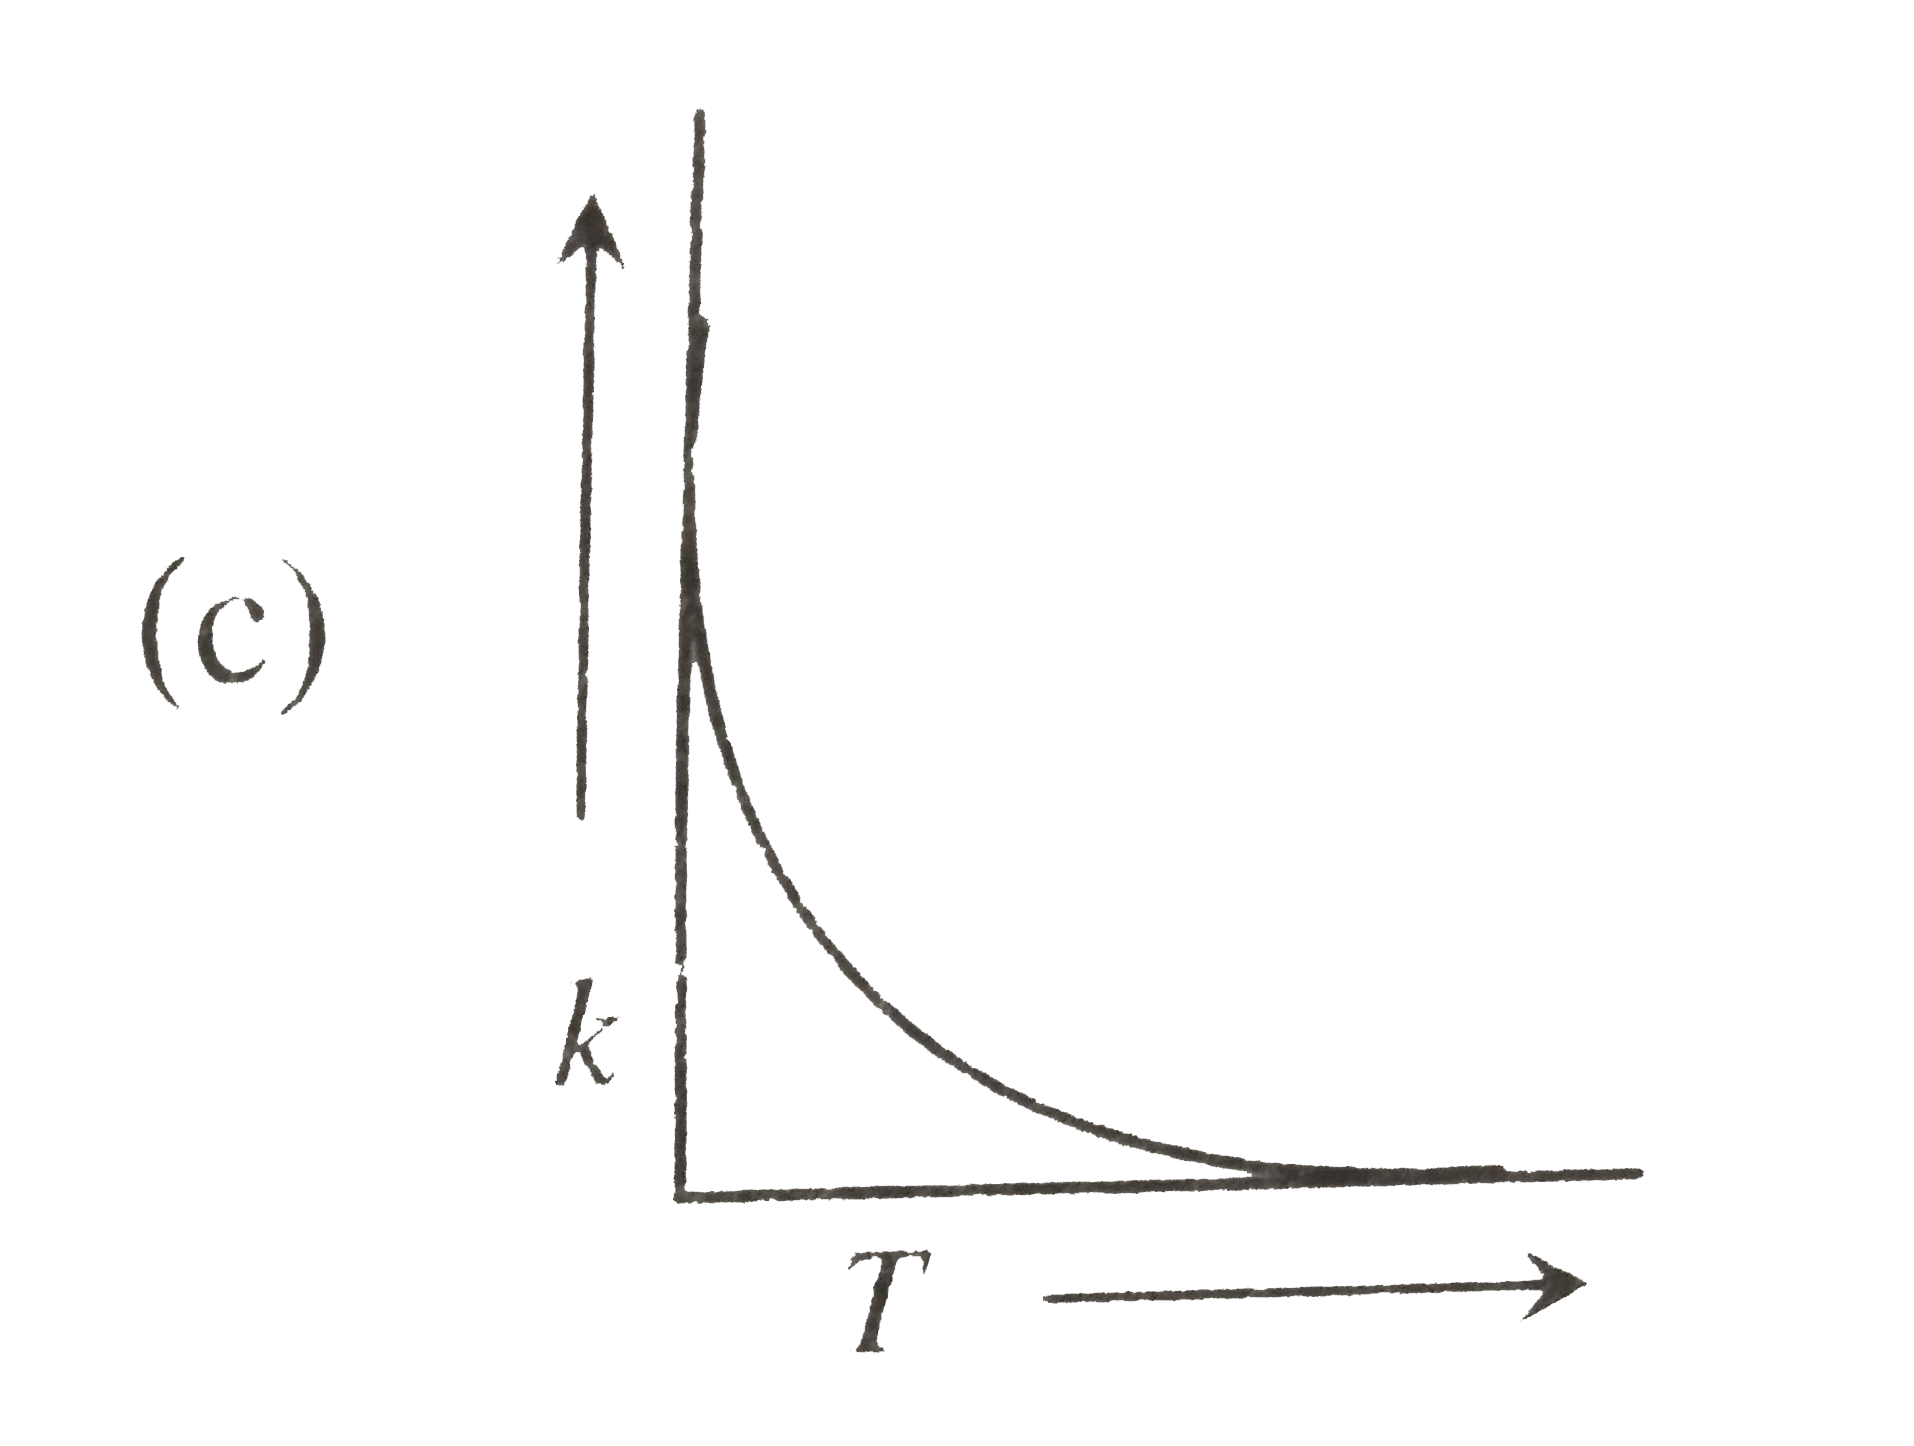
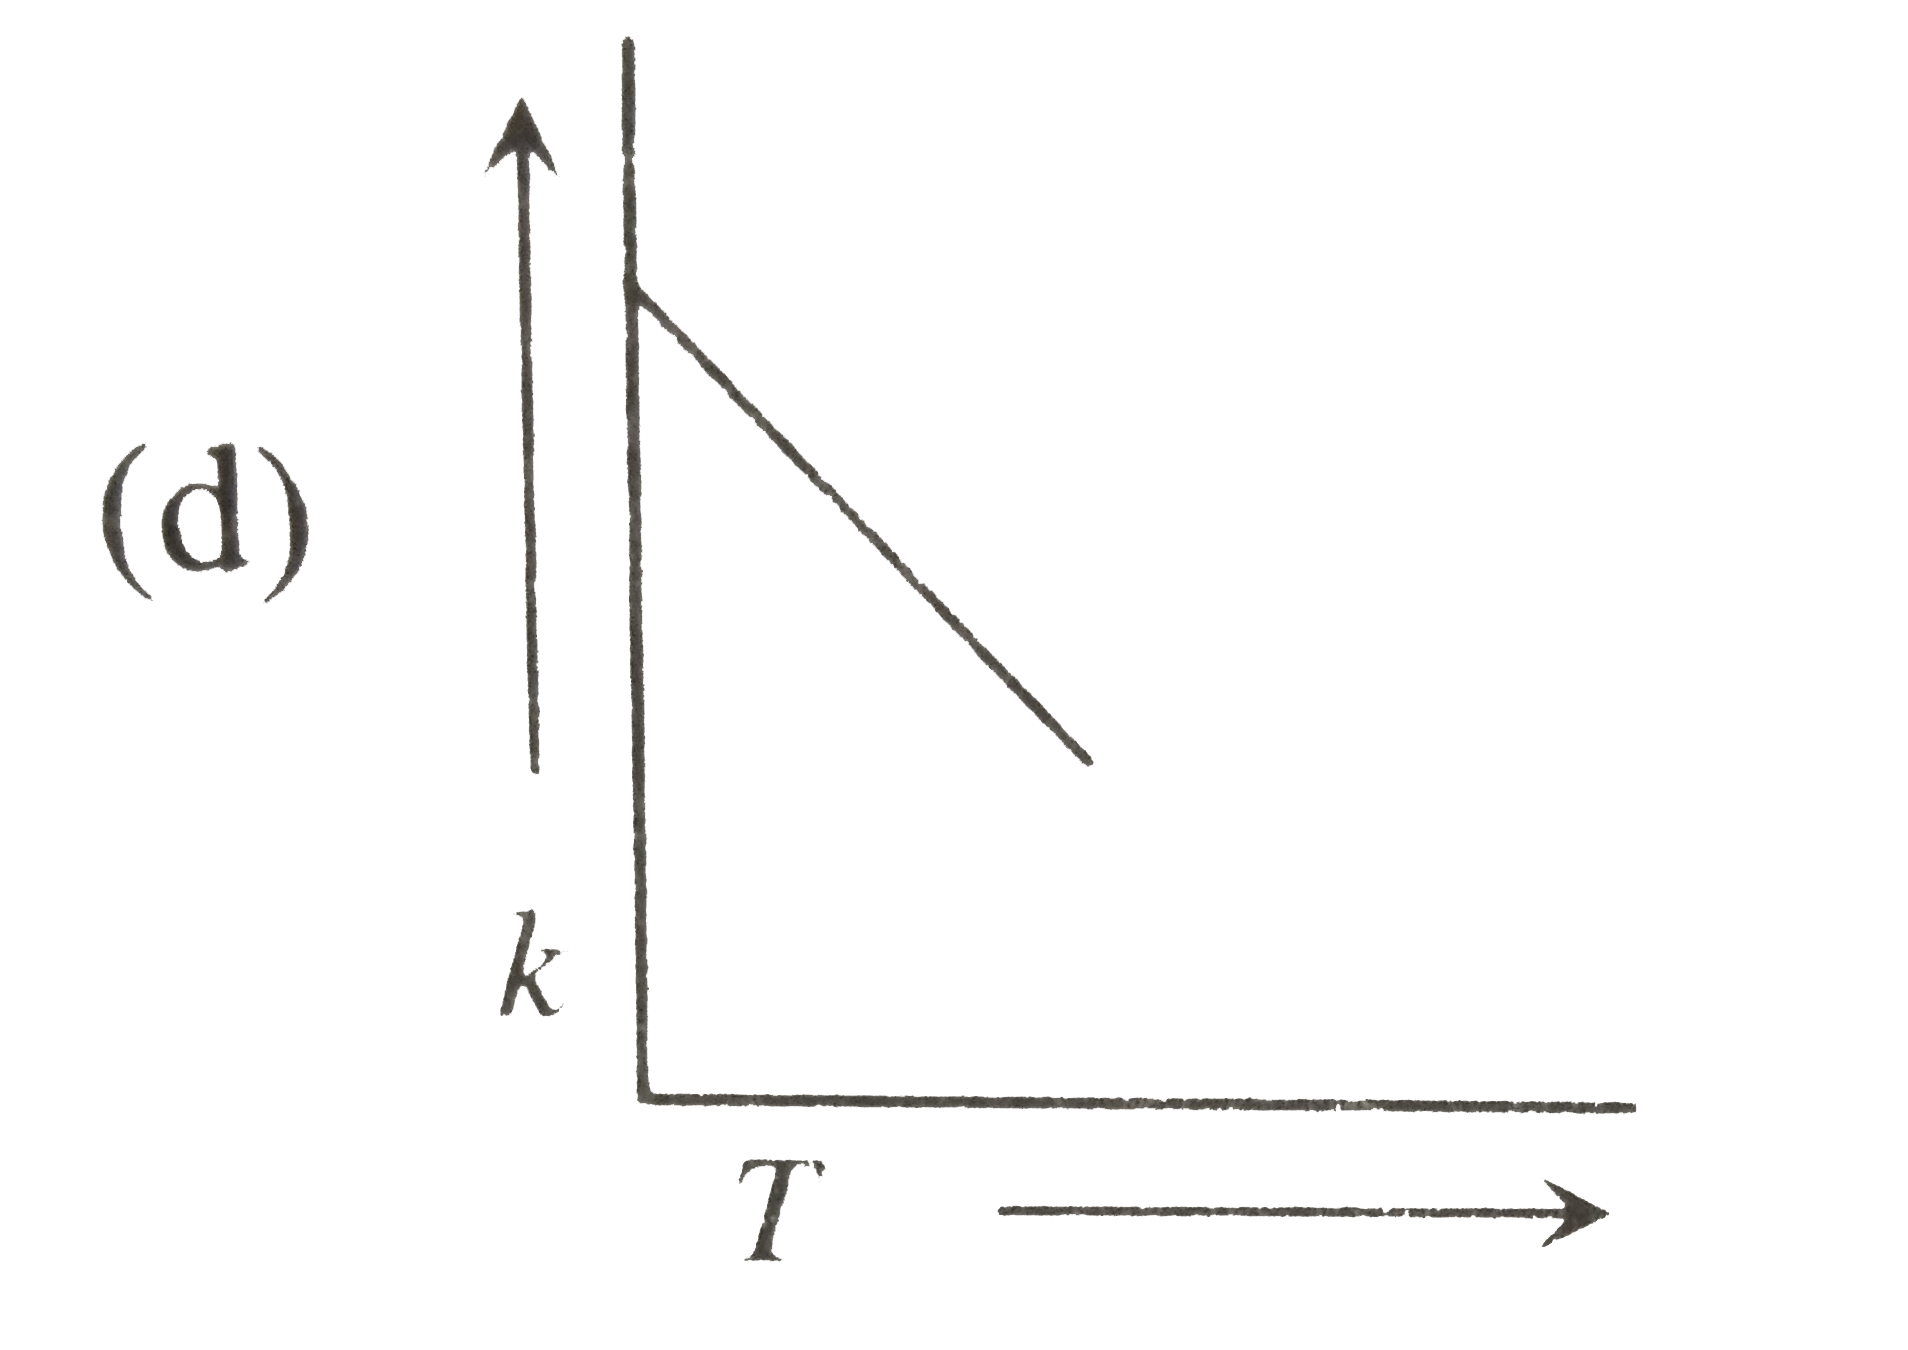
Plots showing the variation of the rate constant (k) with temperature (T) are given below . The plot that follows Arrhenius equation is |
|
Answer»
So , VARIATION will be 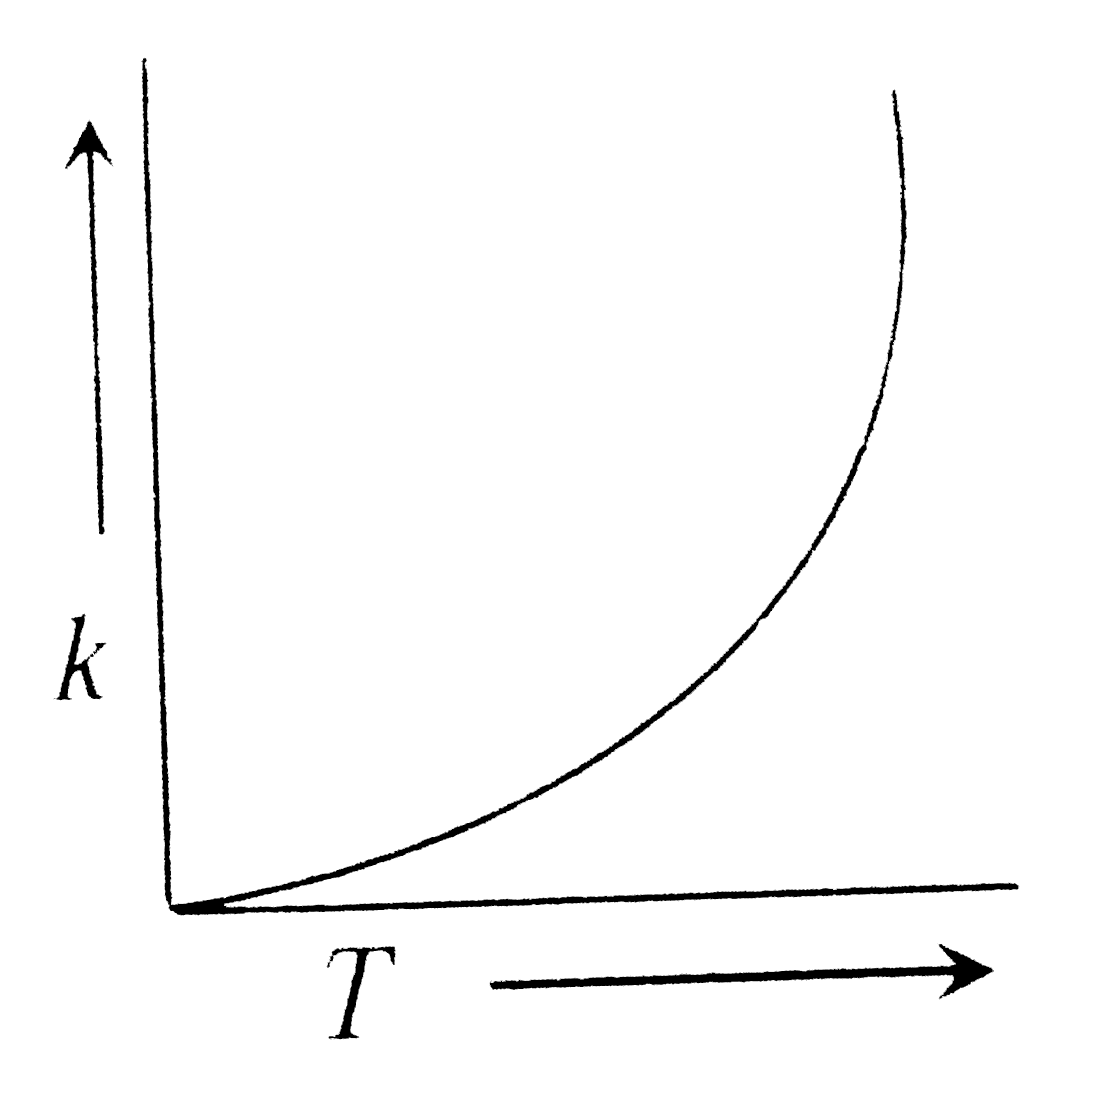
|
|