Saved Bookmarks
| 1. |
Show on a graph the variation of resistivity with temperature for a typical semiconductor |
Answer» Solution :VARIATION of RESISTIVITY of a TYPICAL SEMICONDUCTOR with temperature is SHOWN in Fig.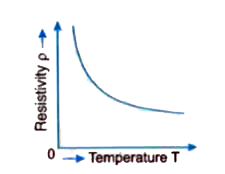
|
|