Saved Bookmarks
| 1. |
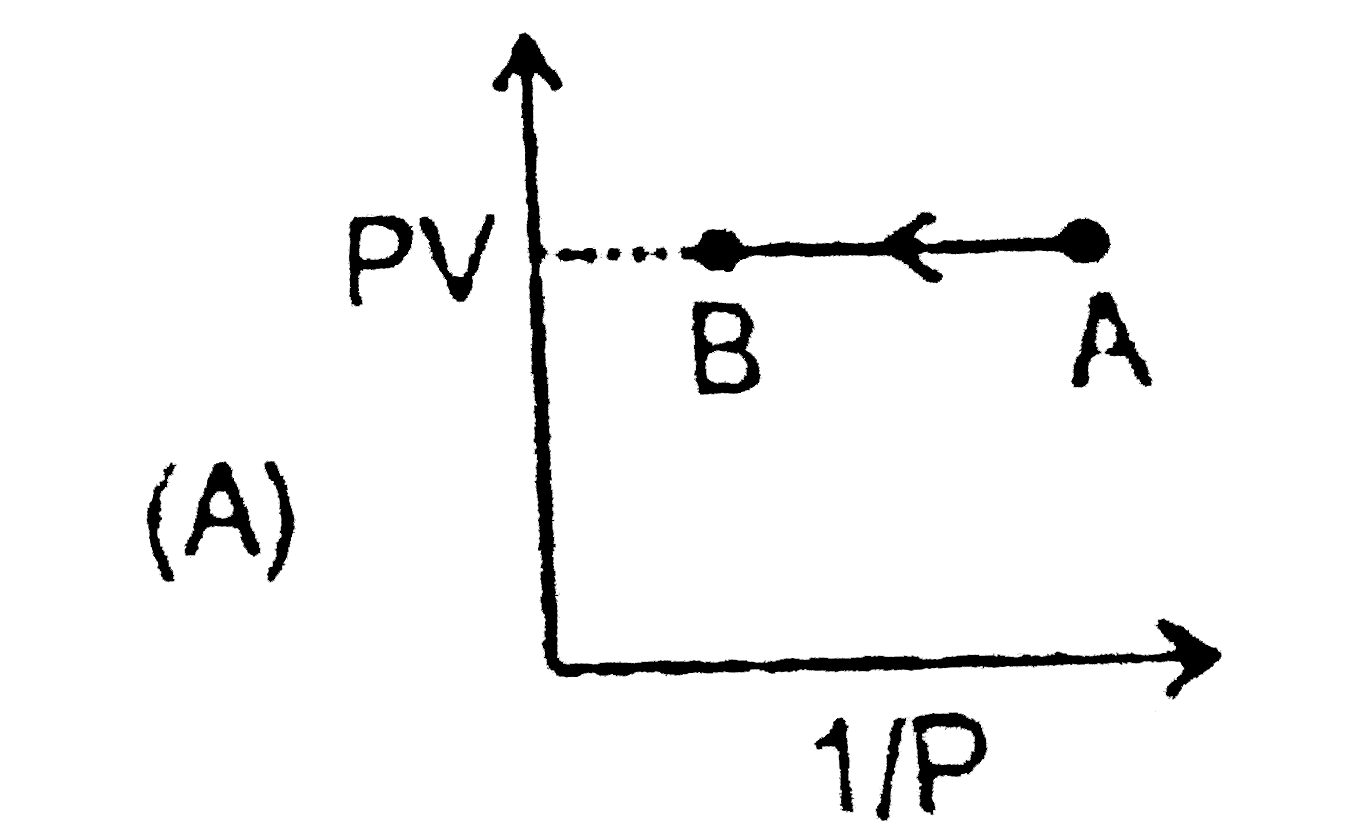
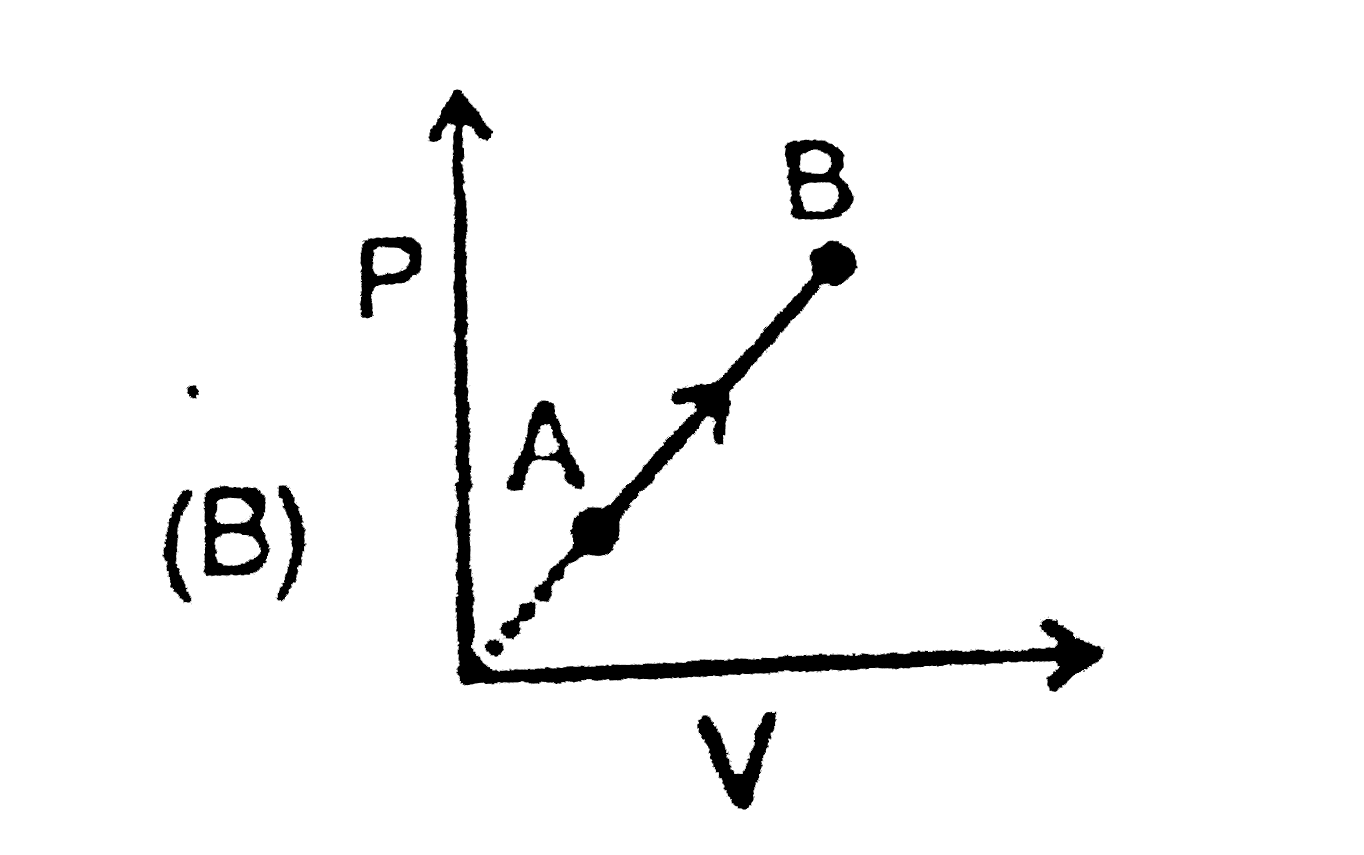
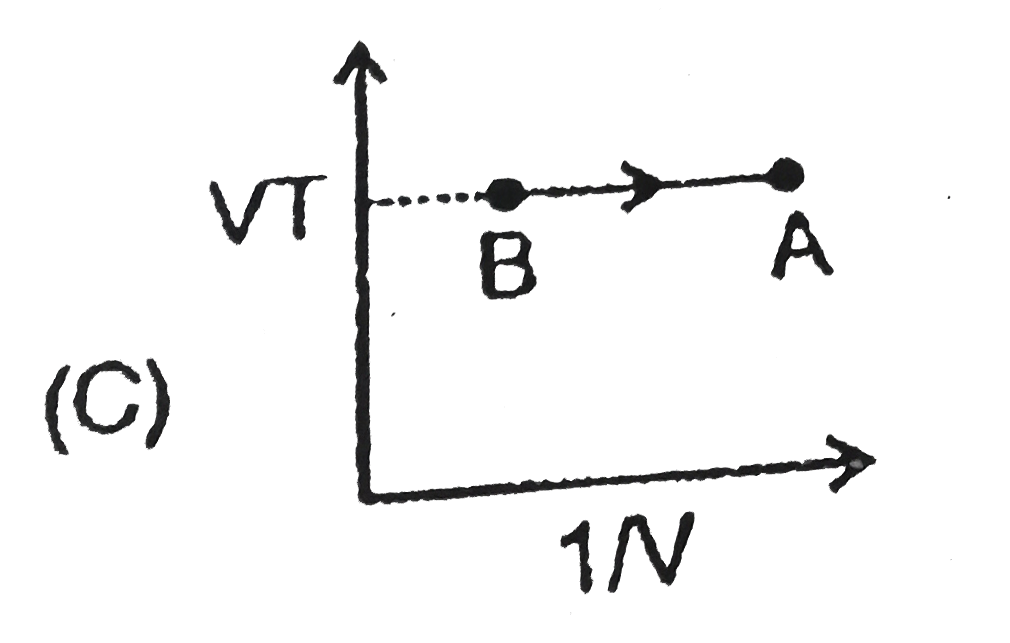
When a sample of ideal gas is changed from an initial state to a final state, various curves can be plotted for the process like P-V curve, V-T curve,P-T curve etc. For example, P-V curve for a fixed amount of an ideal gas at constant temperature is a rectangular hyperbola, V-T curve for a fixed amount of an ideal gas at constant volume is again a straight line. However, the shapes may vary if the constant parameters are also changed. Now, answer the following questions : Which of the following graphs is not possible for a fixed amount of ideal gas upon moving from initial state A to final state B : |
|
Answer» <P> (B)This graph is possible if temperature of gas is increased continuously during the process A to B. ( C)This graph is possible if during the process : `P prop 1/v^2` `because VT="constant" " " :. " " V((PV)/(nR))="Constant" orPV^2="constant"` |
|