Saved Bookmarks
| 1. |
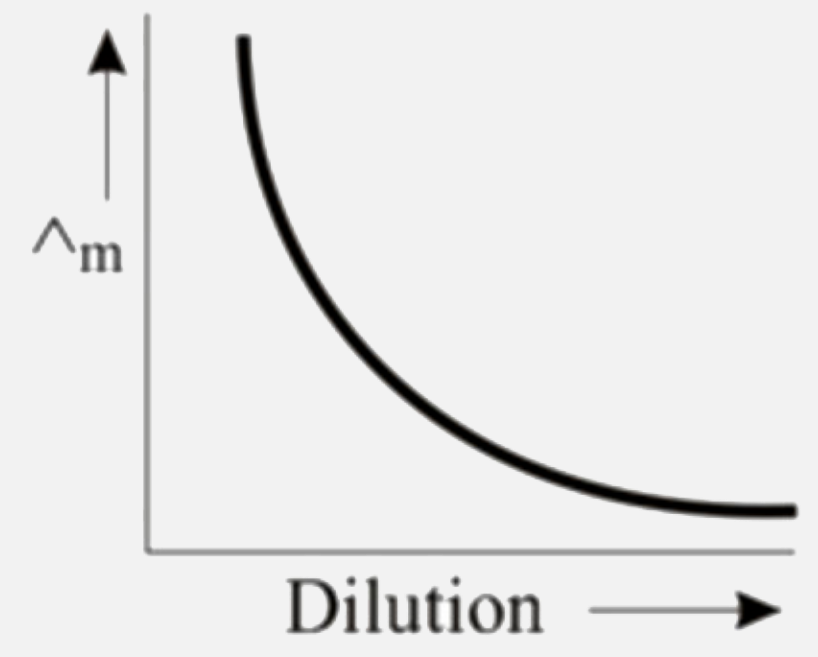
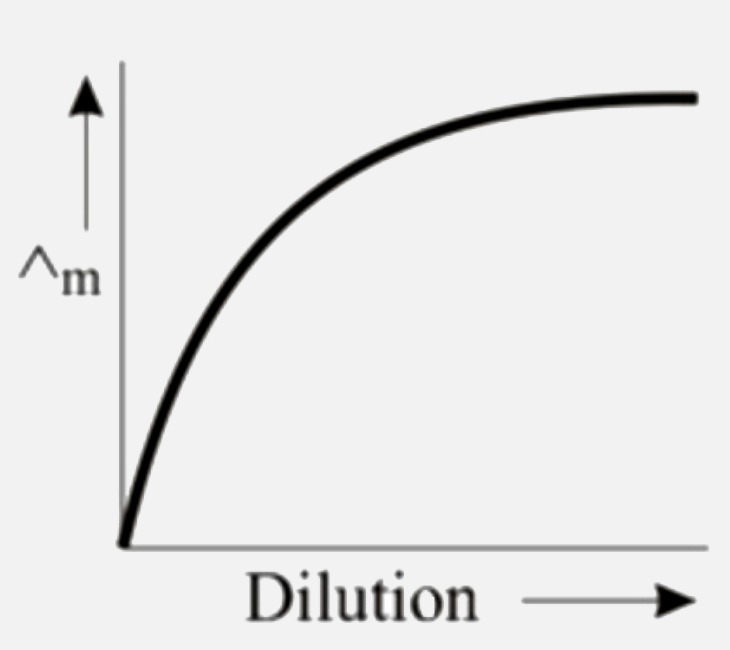
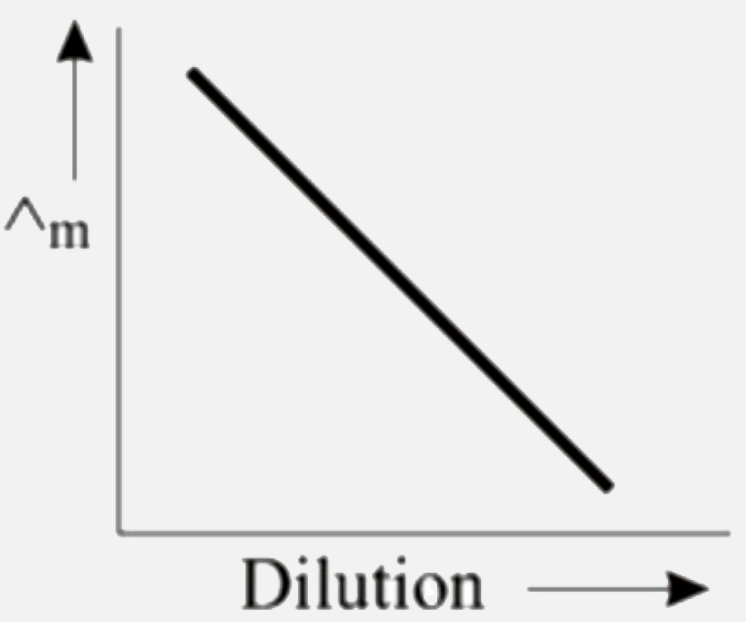
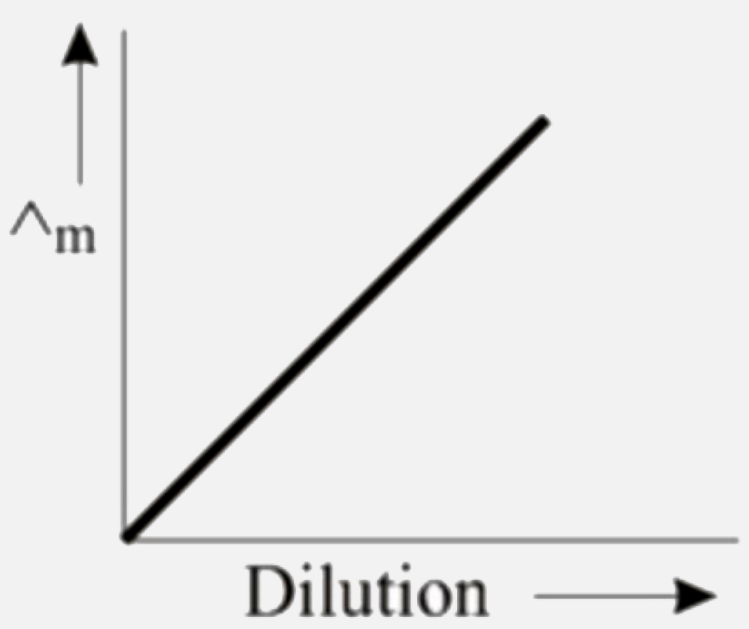
Which of the following graph correctly represents the variation of molar conductance (Delta_m) with dilution for a strong electrolyte ? |
|
Answer»
|
|