Saved Bookmarks
| 1. |
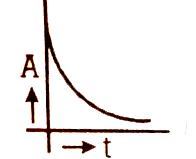
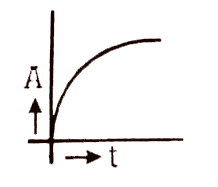
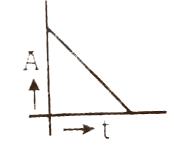
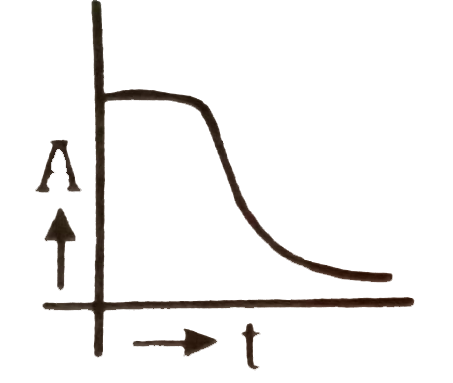
Which of the following graphs represents the variation of activity (A) of a radioactive substance with time (t). |
|
Answer»
|
|