Saved Bookmarks
| 1. |
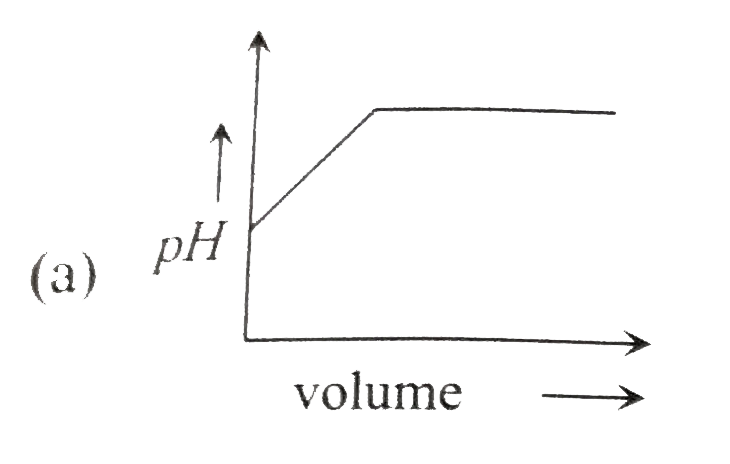
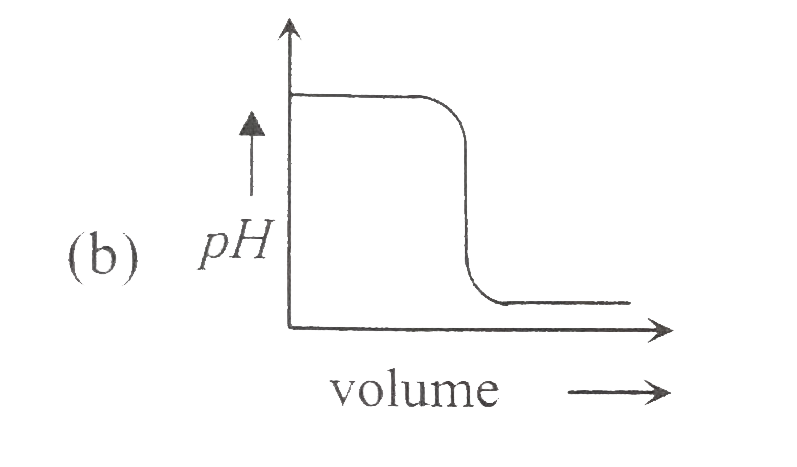
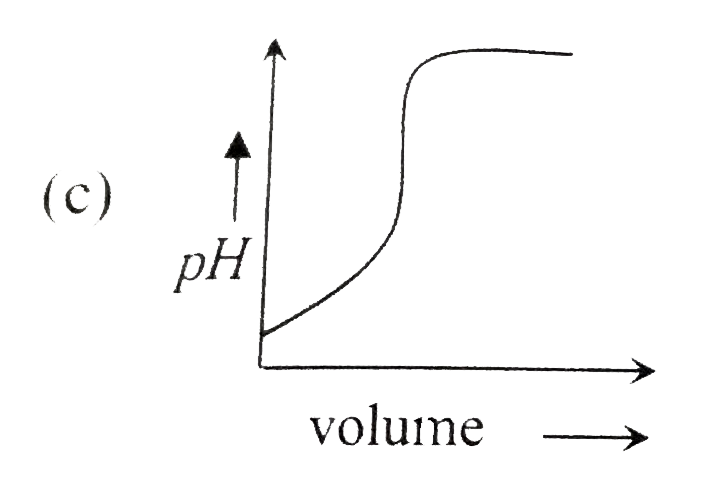
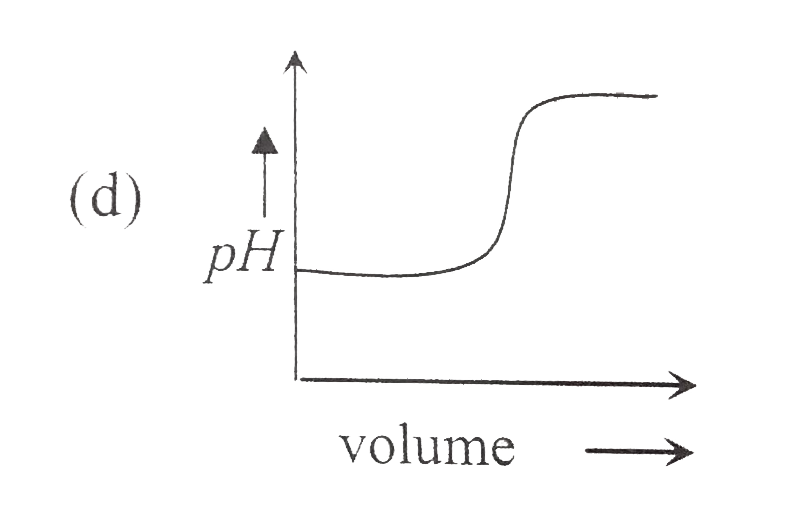
Which of the following plot represents the graph of pH against volume of alkali added in the titration of NaOH and HCl |
|
Answer»
|
|