Saved Bookmarks
| 1. |
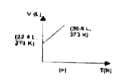
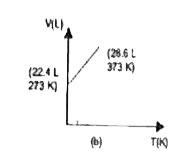
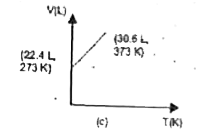
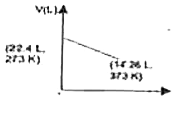
Which of the following volume (V) temperature (T) plots represents the behaviour of one mole of an ideal gas at one atmospheric pressure: |
|
Answer»
|
|