Saved Bookmarks
| 1. |
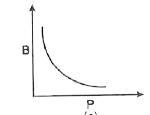
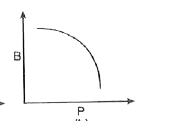
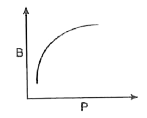
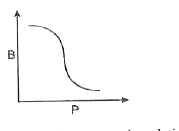
Which of the graphs shown in fig. correctly represents the variation of beta =- (d_(v)// d_(p))//V with P for an ideal gas at constant temperature: |
|
Answer»
At constant temperature PV =constant `THEREFORE` Differentiating both side `PDV +vdP =0` `(DV)/(dP) =-(V)/(P)` `rArr -((1)/(V) (dV)/(dP))=(1)/(P)` or `beta =(1)/(P)` THUS, `beta` decrease as P INCREASES Hence, the correct choice is (a). |
|