Home
About Us
Contact Us
Bookmark
Saved Bookmarks
Current Affairs
General Knowledge
Chemical Engineering
UPSEE
BSNL
ISRO
BITSAT
Amazon
ORACLE
Verbal Ability
→
Class 12
→
Accounts in Class 12
→
whichone of thefollowingcurvesrepresents thegraph...
1.
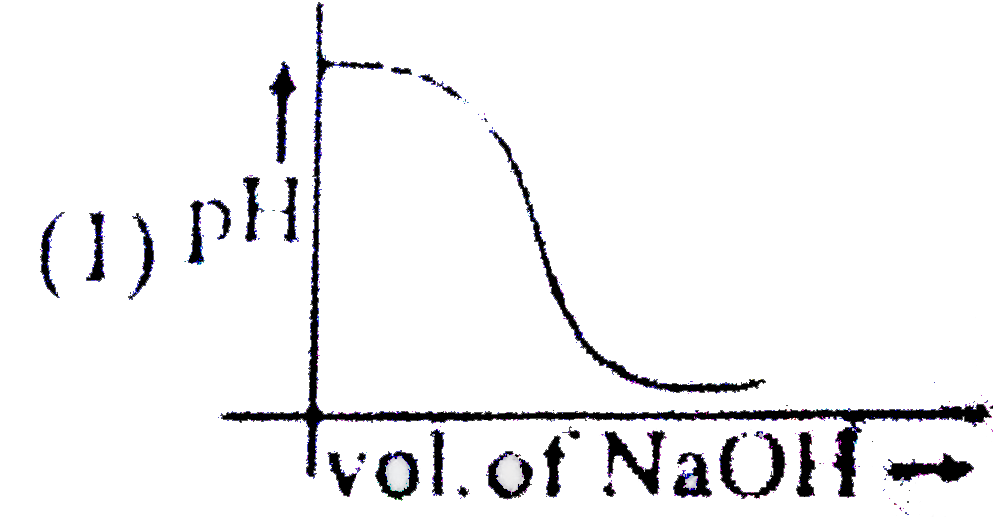
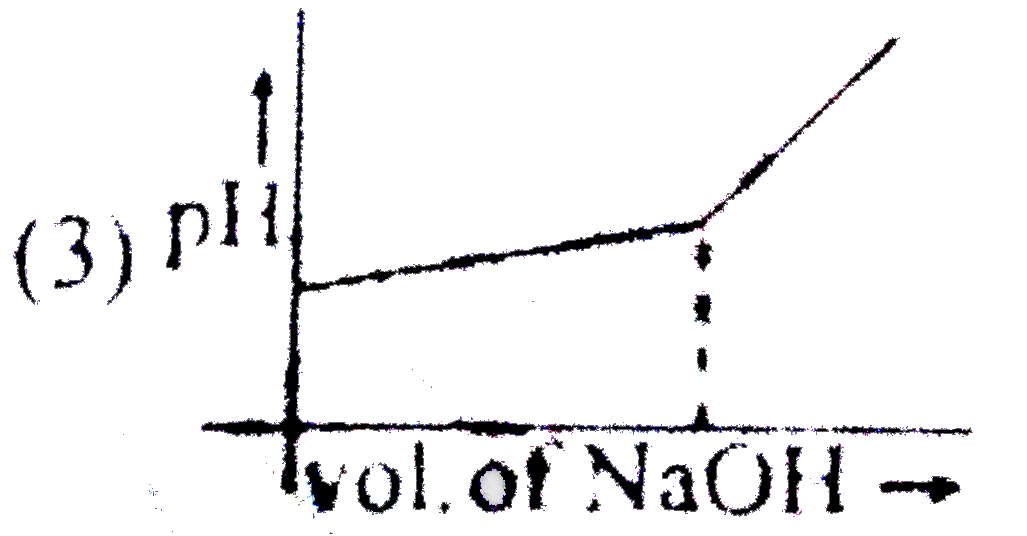
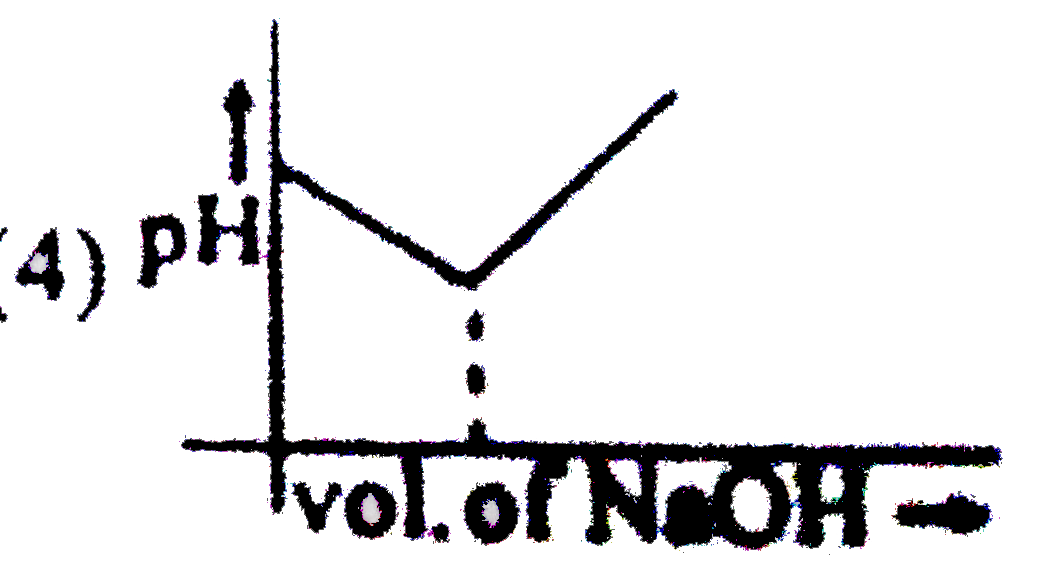
whichone of thefollowingcurvesrepresents thegraph of pHduring titrationof NaOH and HCl (aq).?
Answer»
SOLUTION
:pHfirstalmostraminssamethansuddenly `
UARR
` andthenbecomealmost same .
Show Answer
Discussion
No Comment Found
Post Comment
Related InterviewSolutions
A wire is bent to form a semicircle of the radius a. The wire rotates about its one end with angular velocity omega . Axis of rotation is perpendicular to the plane of the semicircle . In the space , a uniform magnetic field of induction B exists along the aixs of rotation as shown in the figure . Then -
A massless non conducting rod AB of length 2l is placed in uniform time varying magnetic field confined in a cylindrical region of radius (R gt l) as shown in the figure. The center of the rod coincides with the centre of the cylin- drical region. The rod can freely rotate in the plane of the Figure about an axis coinciding with the axis of the cylinder. Two particles, each of mass m and charge q are attached to the ends A and B of the rod. The time varying magnetic field in this cylindrical region is given by B = B_(0) [1-(t)/(2)] where B_(0) is a constant. The field is switched on at time t = 0. Consider B_(0) = 100T, l = 4 cm(q)/(m) = (4pi)/(100) C//kg. Calculate the time in which the rod will reach position CD shown in the figure for th first time. Will end A be at C or D at this instant ?
A concave lens with equal radius of curvature both sides has a focal length of 12 cm. The refractive index of the lens is 1.5. How will the focal length of the lens change if it is immersed in the liquid of refractive index 1.8 ?
If the tempearture of black body is raised by 5%, the heat energy radiated would increases by :
What are the co-ordinates of the image of S formed by a plane mirror as shown in figure?
The direction of ray of light incident on a concave mirror is shown by PQ in Fig. The direction in which the ray would travel after reflection is shown by four rays marked 1, 2, 3 and 4. Which of the four rays correctly shows the direction of reflected ray?
What is meant by polarisation ?
Two concentric coils each of radius equal to 2πcm are placed right angles to each other. If 3 A and 4 A are the currents flowing through the two coils respectively. The magnetic induction( in Wb m^(-2) )at the center of the coils will be
Assertion: Out of ""_(1)He^(3) and ""_(7)He^(3), the binding energy of ""_(1)He^(3)is greater than ""_(2)He^(8). Reason: Inside the nucleus of""_(1)H^(3), there is more repulsion than inside the nucleus of ""_(2)He^(4).
In which accelerated motion, K.E of the particle is constant
Reply to Comment
×
Name
*
Email
*
Comment
*
Submit Reply
Your experience on this site will be improved by allowing cookies. Read
Cookie Policy
Reject
Allow cookies