Saved Bookmarks
| 1. |
100 surnames were randomly picked up from a local telephone directory and a frequency distribution of the number of letter in English alphabet in the surnames was found as follows: (i) Draw a histogram to depict the given information. (ii) Write the class interval in which the maximum number of surnames lie. |
|
Answer» Solution :(i) We know that, the areas of the rectangles are proportional to the frequencies in a HISTOGRAM. Here, the widths of the rectangles are VARYING. So, we need to make certain modifications in the lengths of the rectangle. So that the areas are again proportional to the frequencies. 1 Select a class interval with the minimum class SIZE. The minimum class size is 2. 2. The lengths of the rectangles are then modified to be proportionate to the class-size 2. SINCE, we have calculated these lengths for interval of 2 letters in each case, we may call these lengths as 'proportion of surnames per 2 mark interval'. So, the correct histogram with varying width is given below: Here, we make a modified table by given data with minimum class-size 2 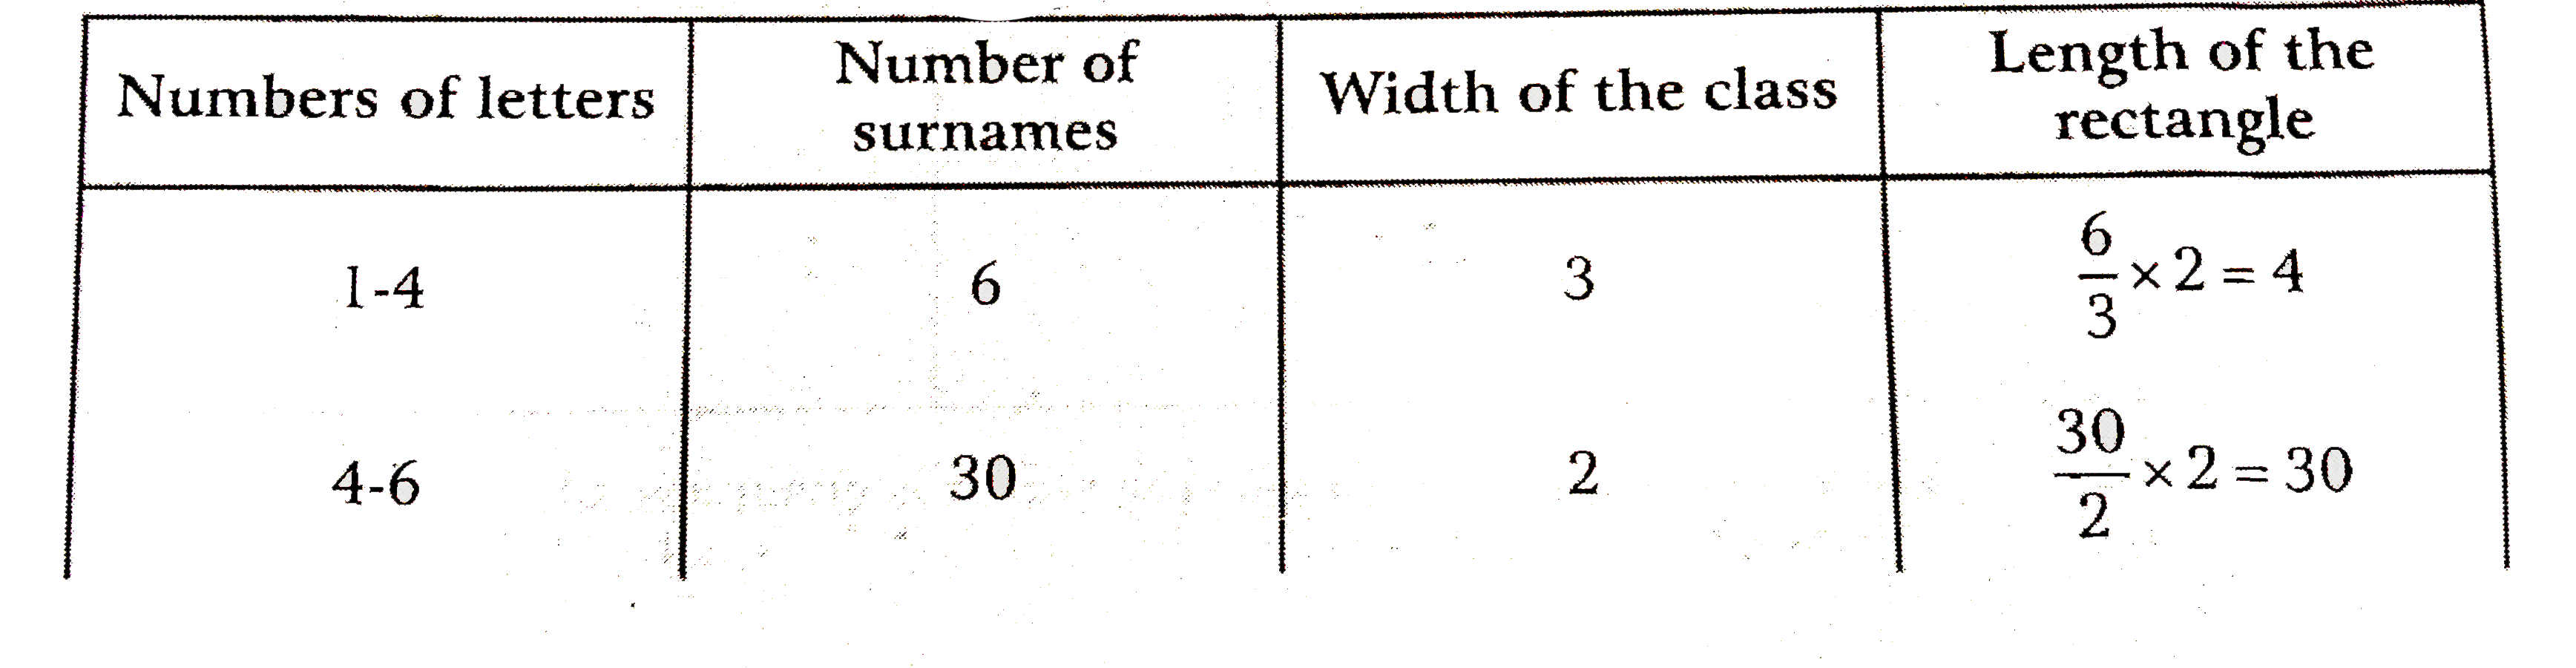 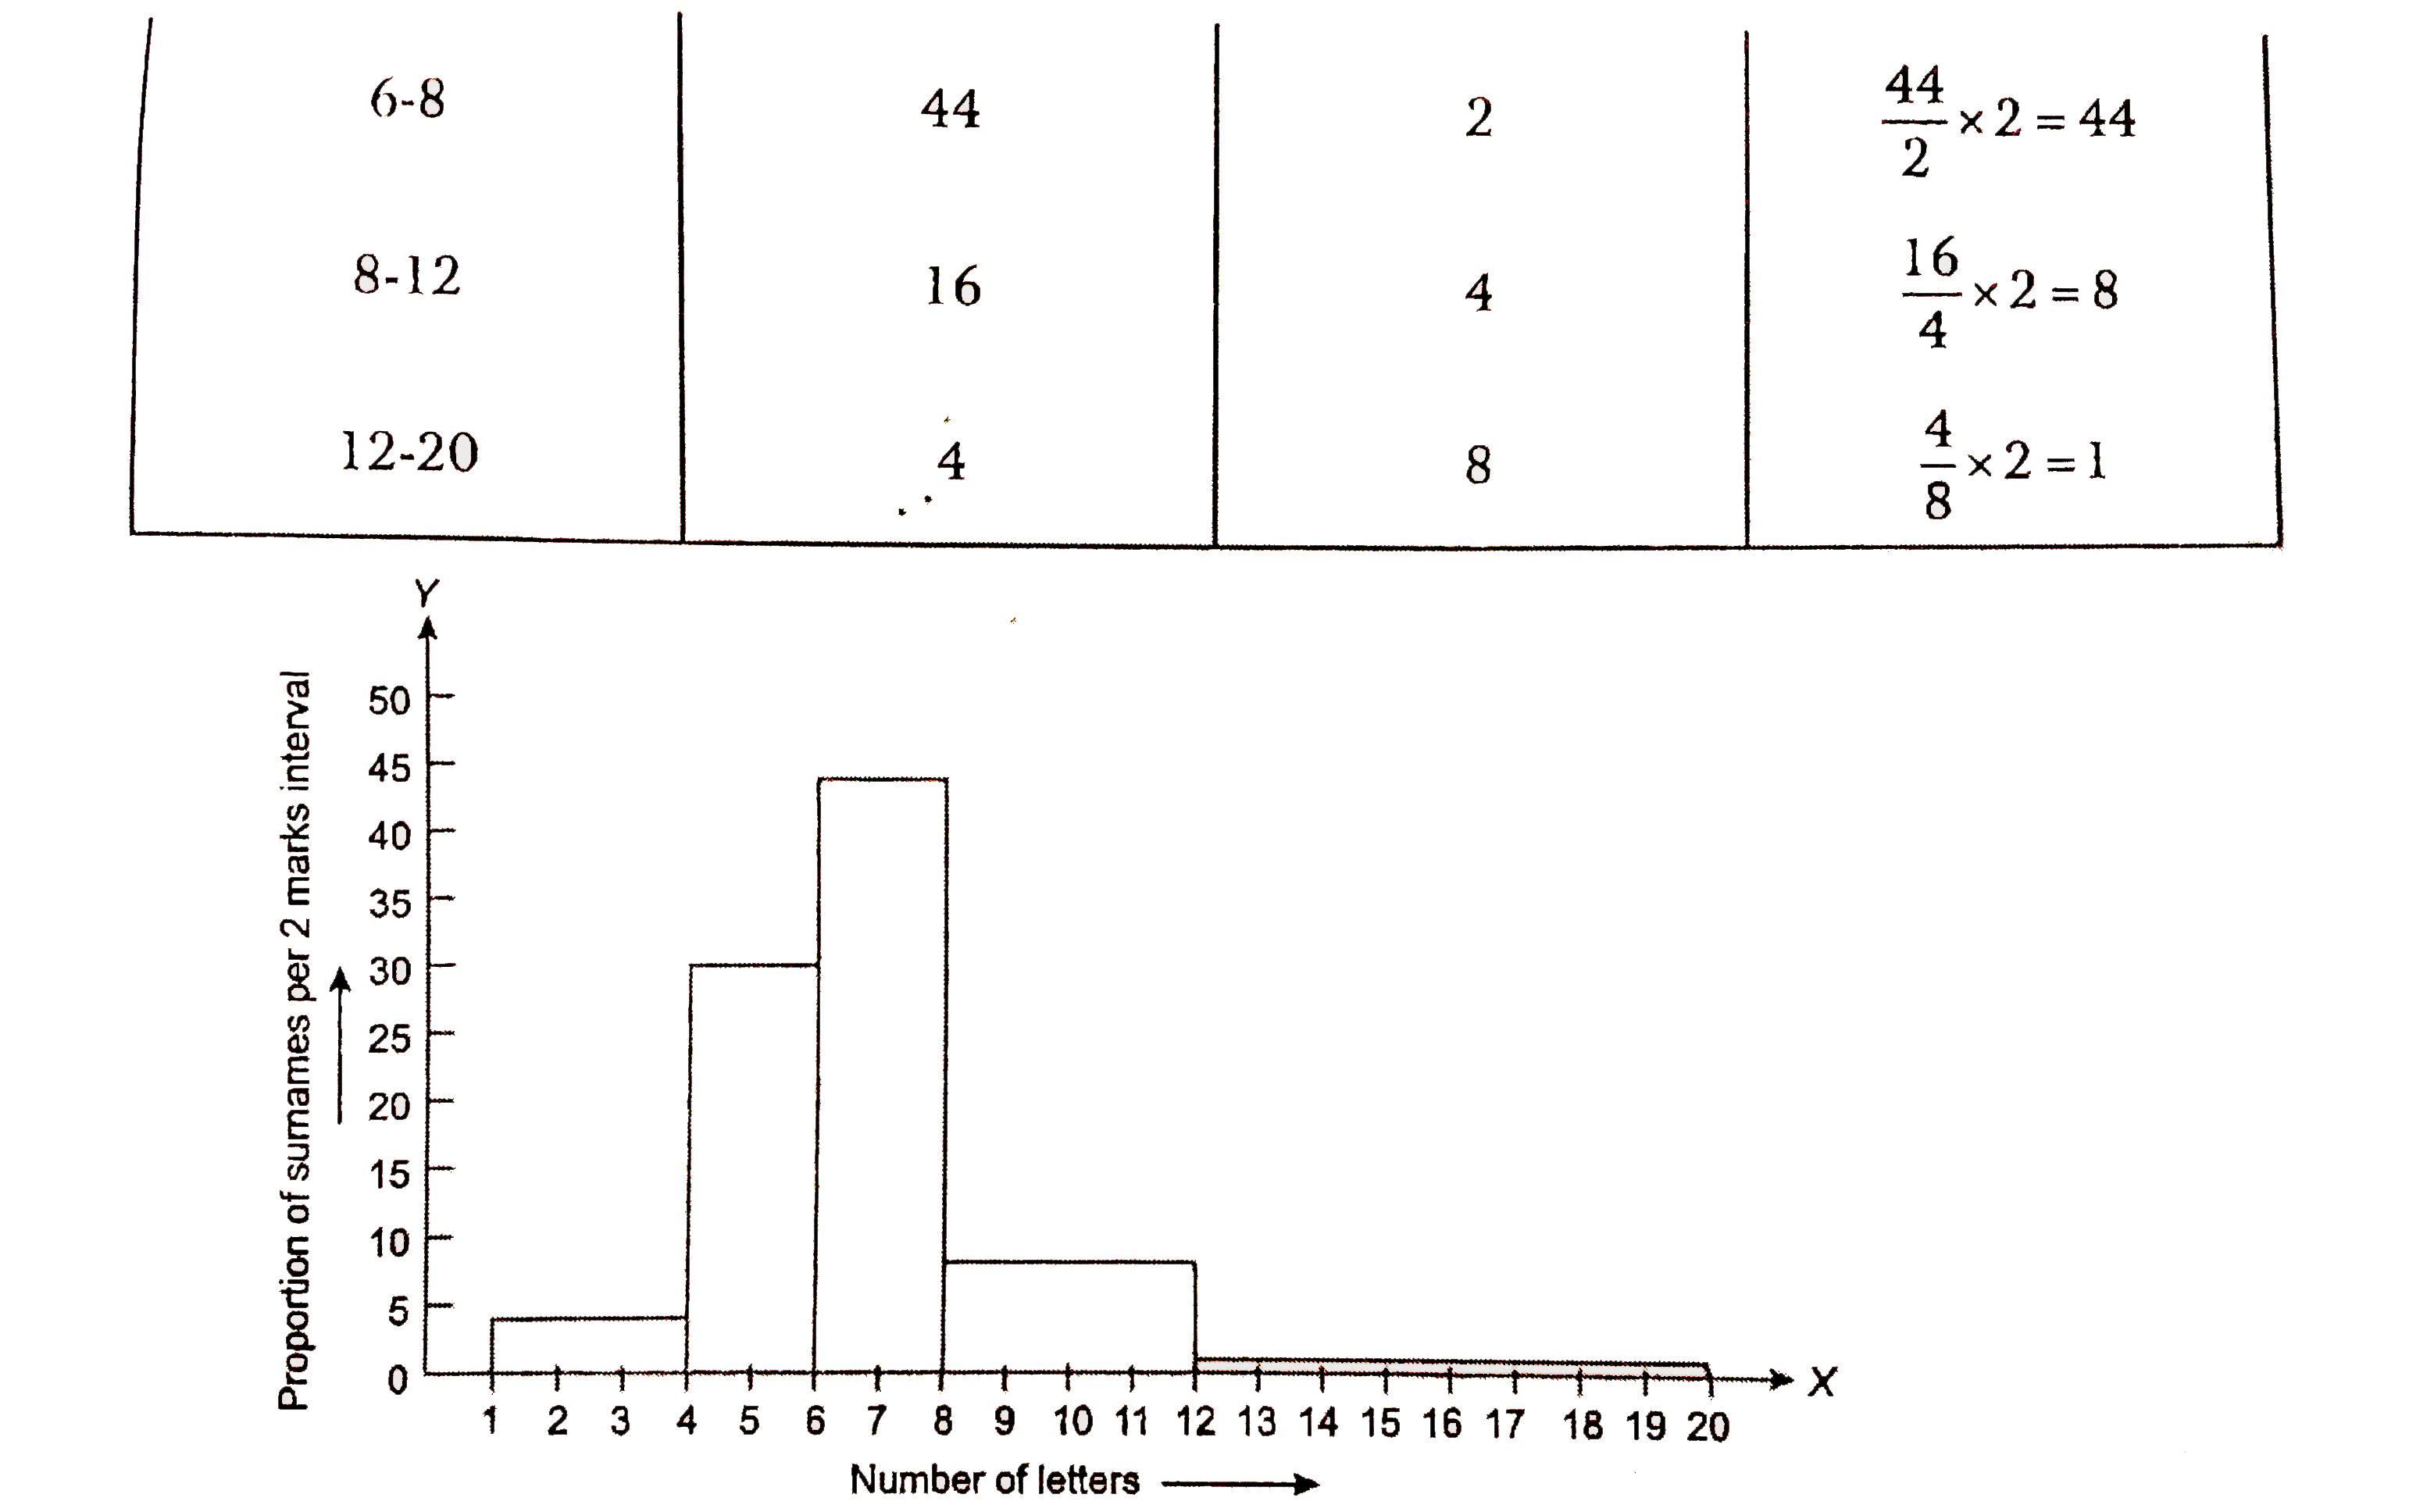 (ii) The class interval in which the maximum number of surnames lie is 6-8. |
|