Saved Bookmarks
| 1. |
A random survey of the number of children of various are groups playing in park was found as follows : Draw a histogram to represent the data above. |
|
Answer» Solution :We know that, the areas of the rectangles are proportional to the frequencies in a histogram. Here, the widths to the rectangles are varying, so we NEED to make certain modifications in the lengths of the rectangles, so that the areas are again proportional to the frequencies : 1. SELECT a class interval with the minimum class size. The minium class size is 1. 2. The lengths of the rectangles are then modified to be proportionate to the class size 1. Now, we get the FOLLOWING table: 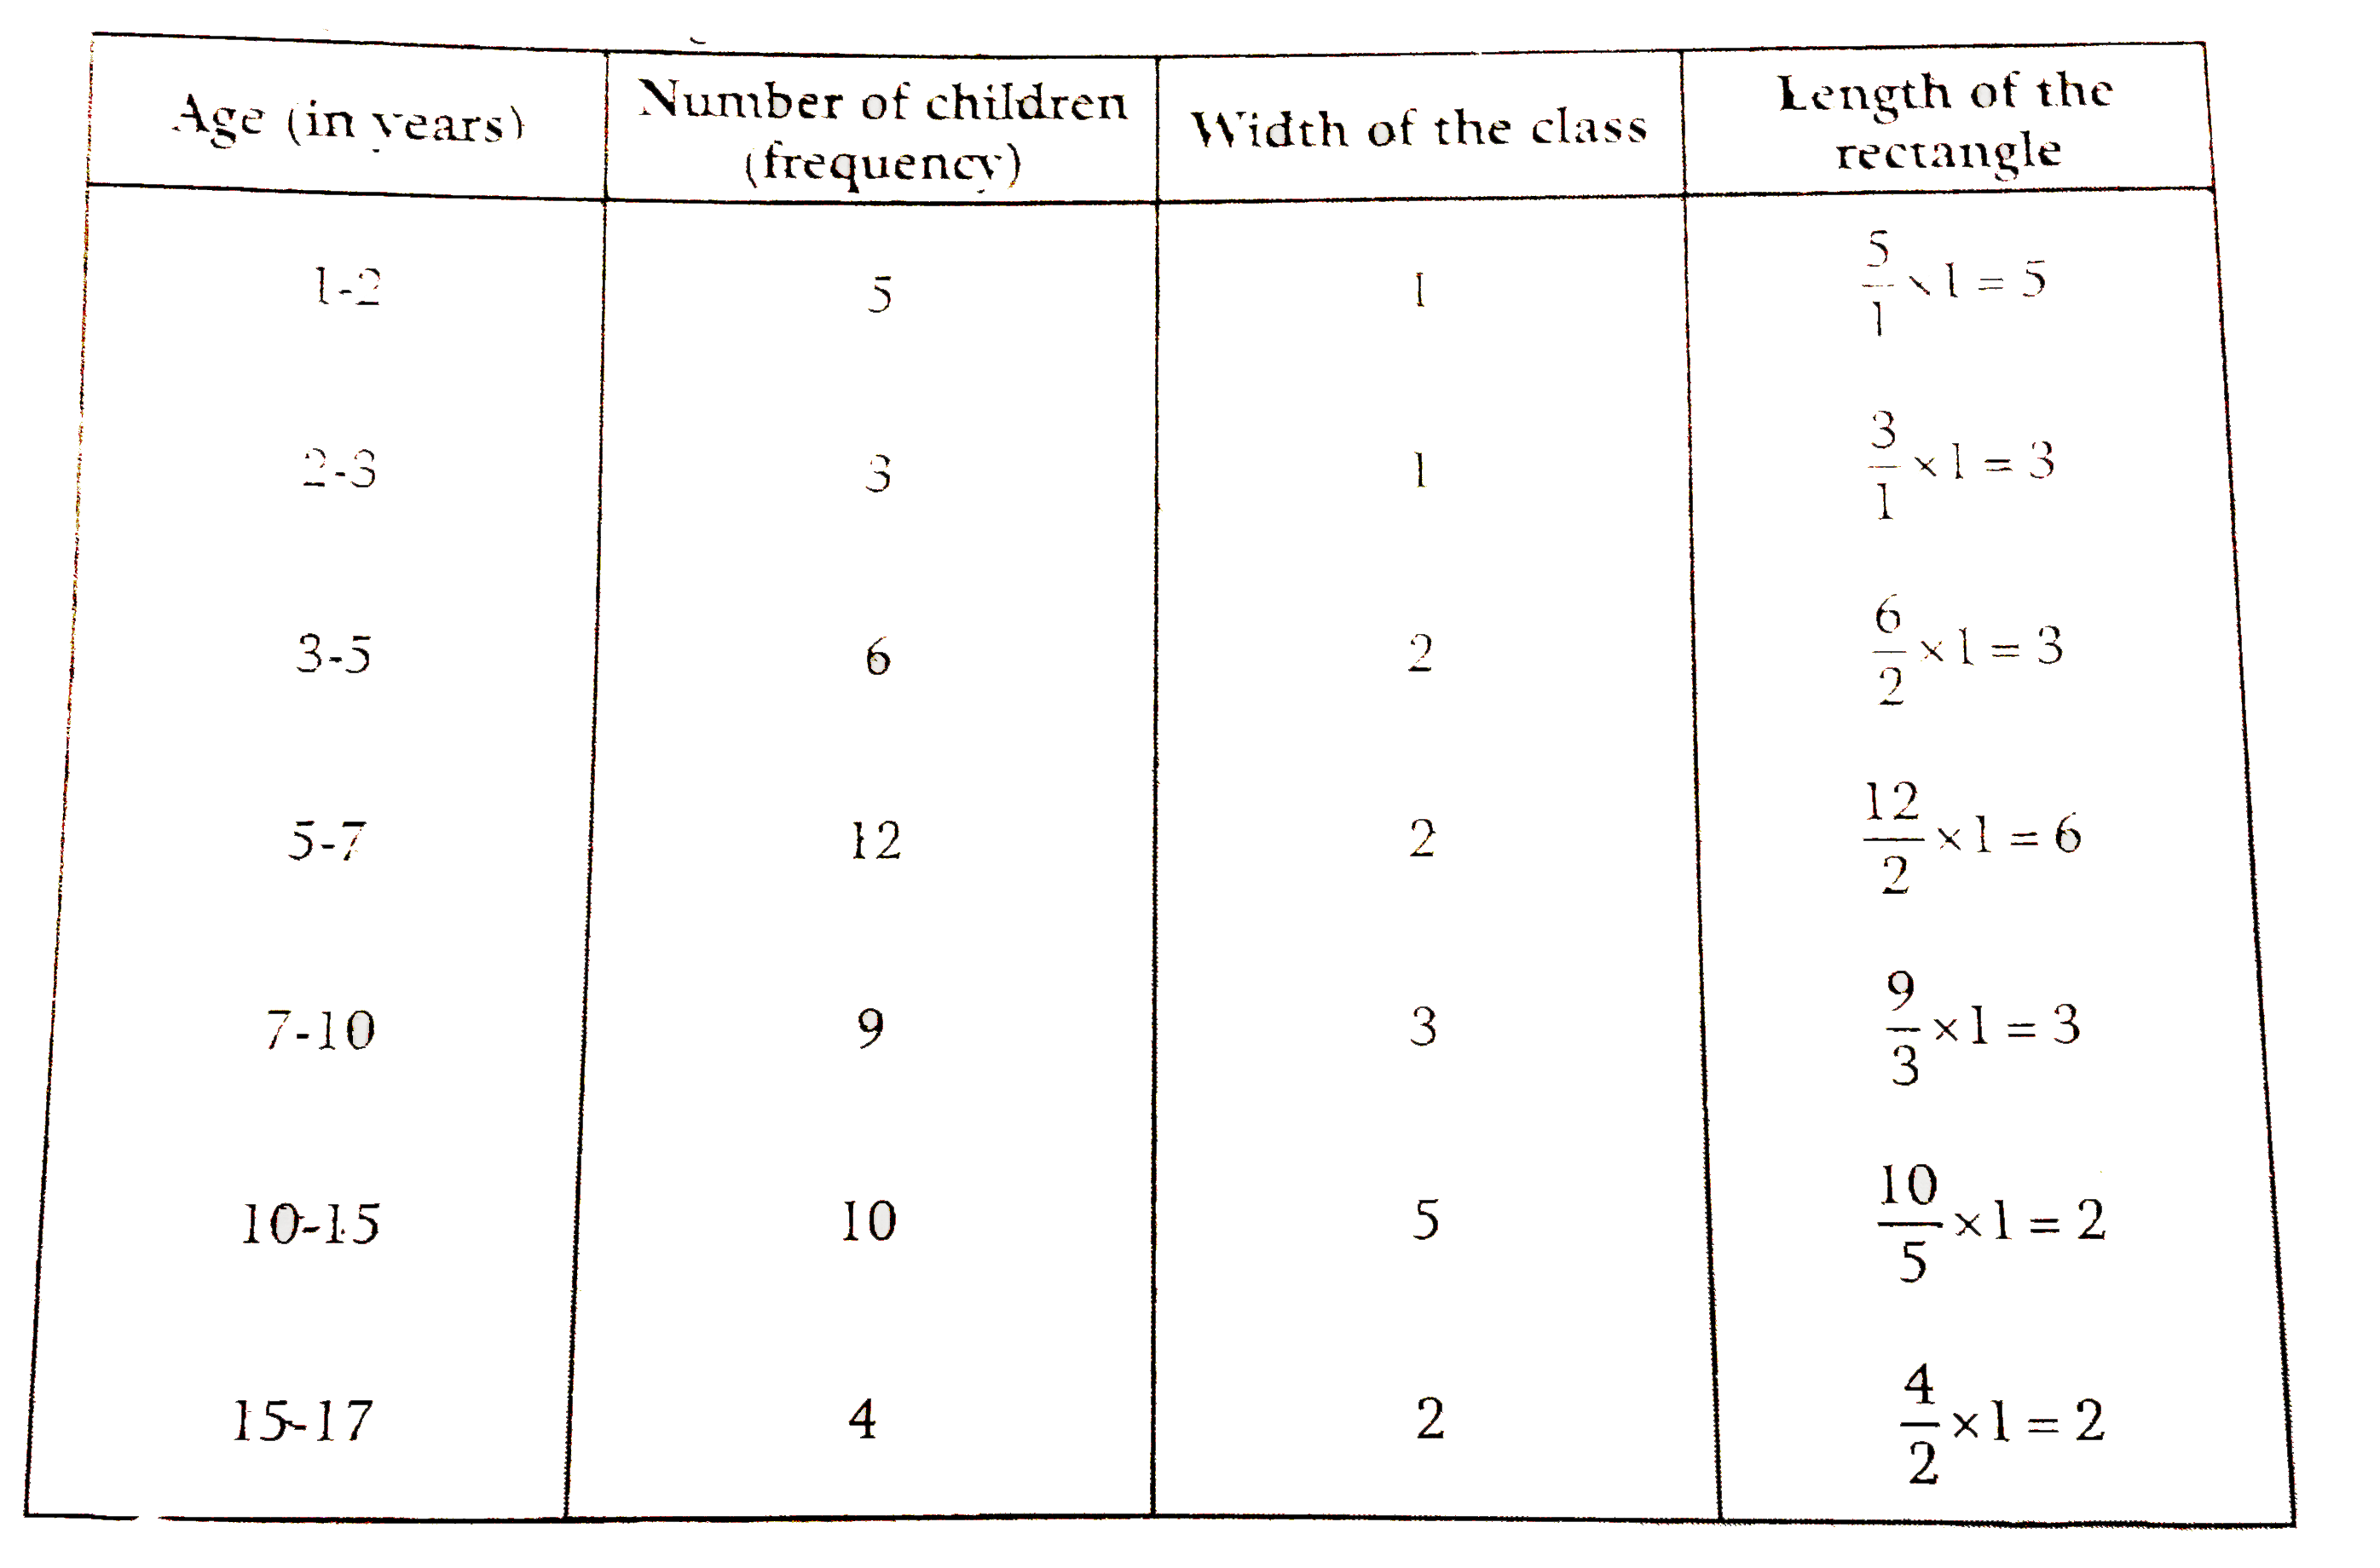 So, the correct histogram with varying width is GIVEN ahead. 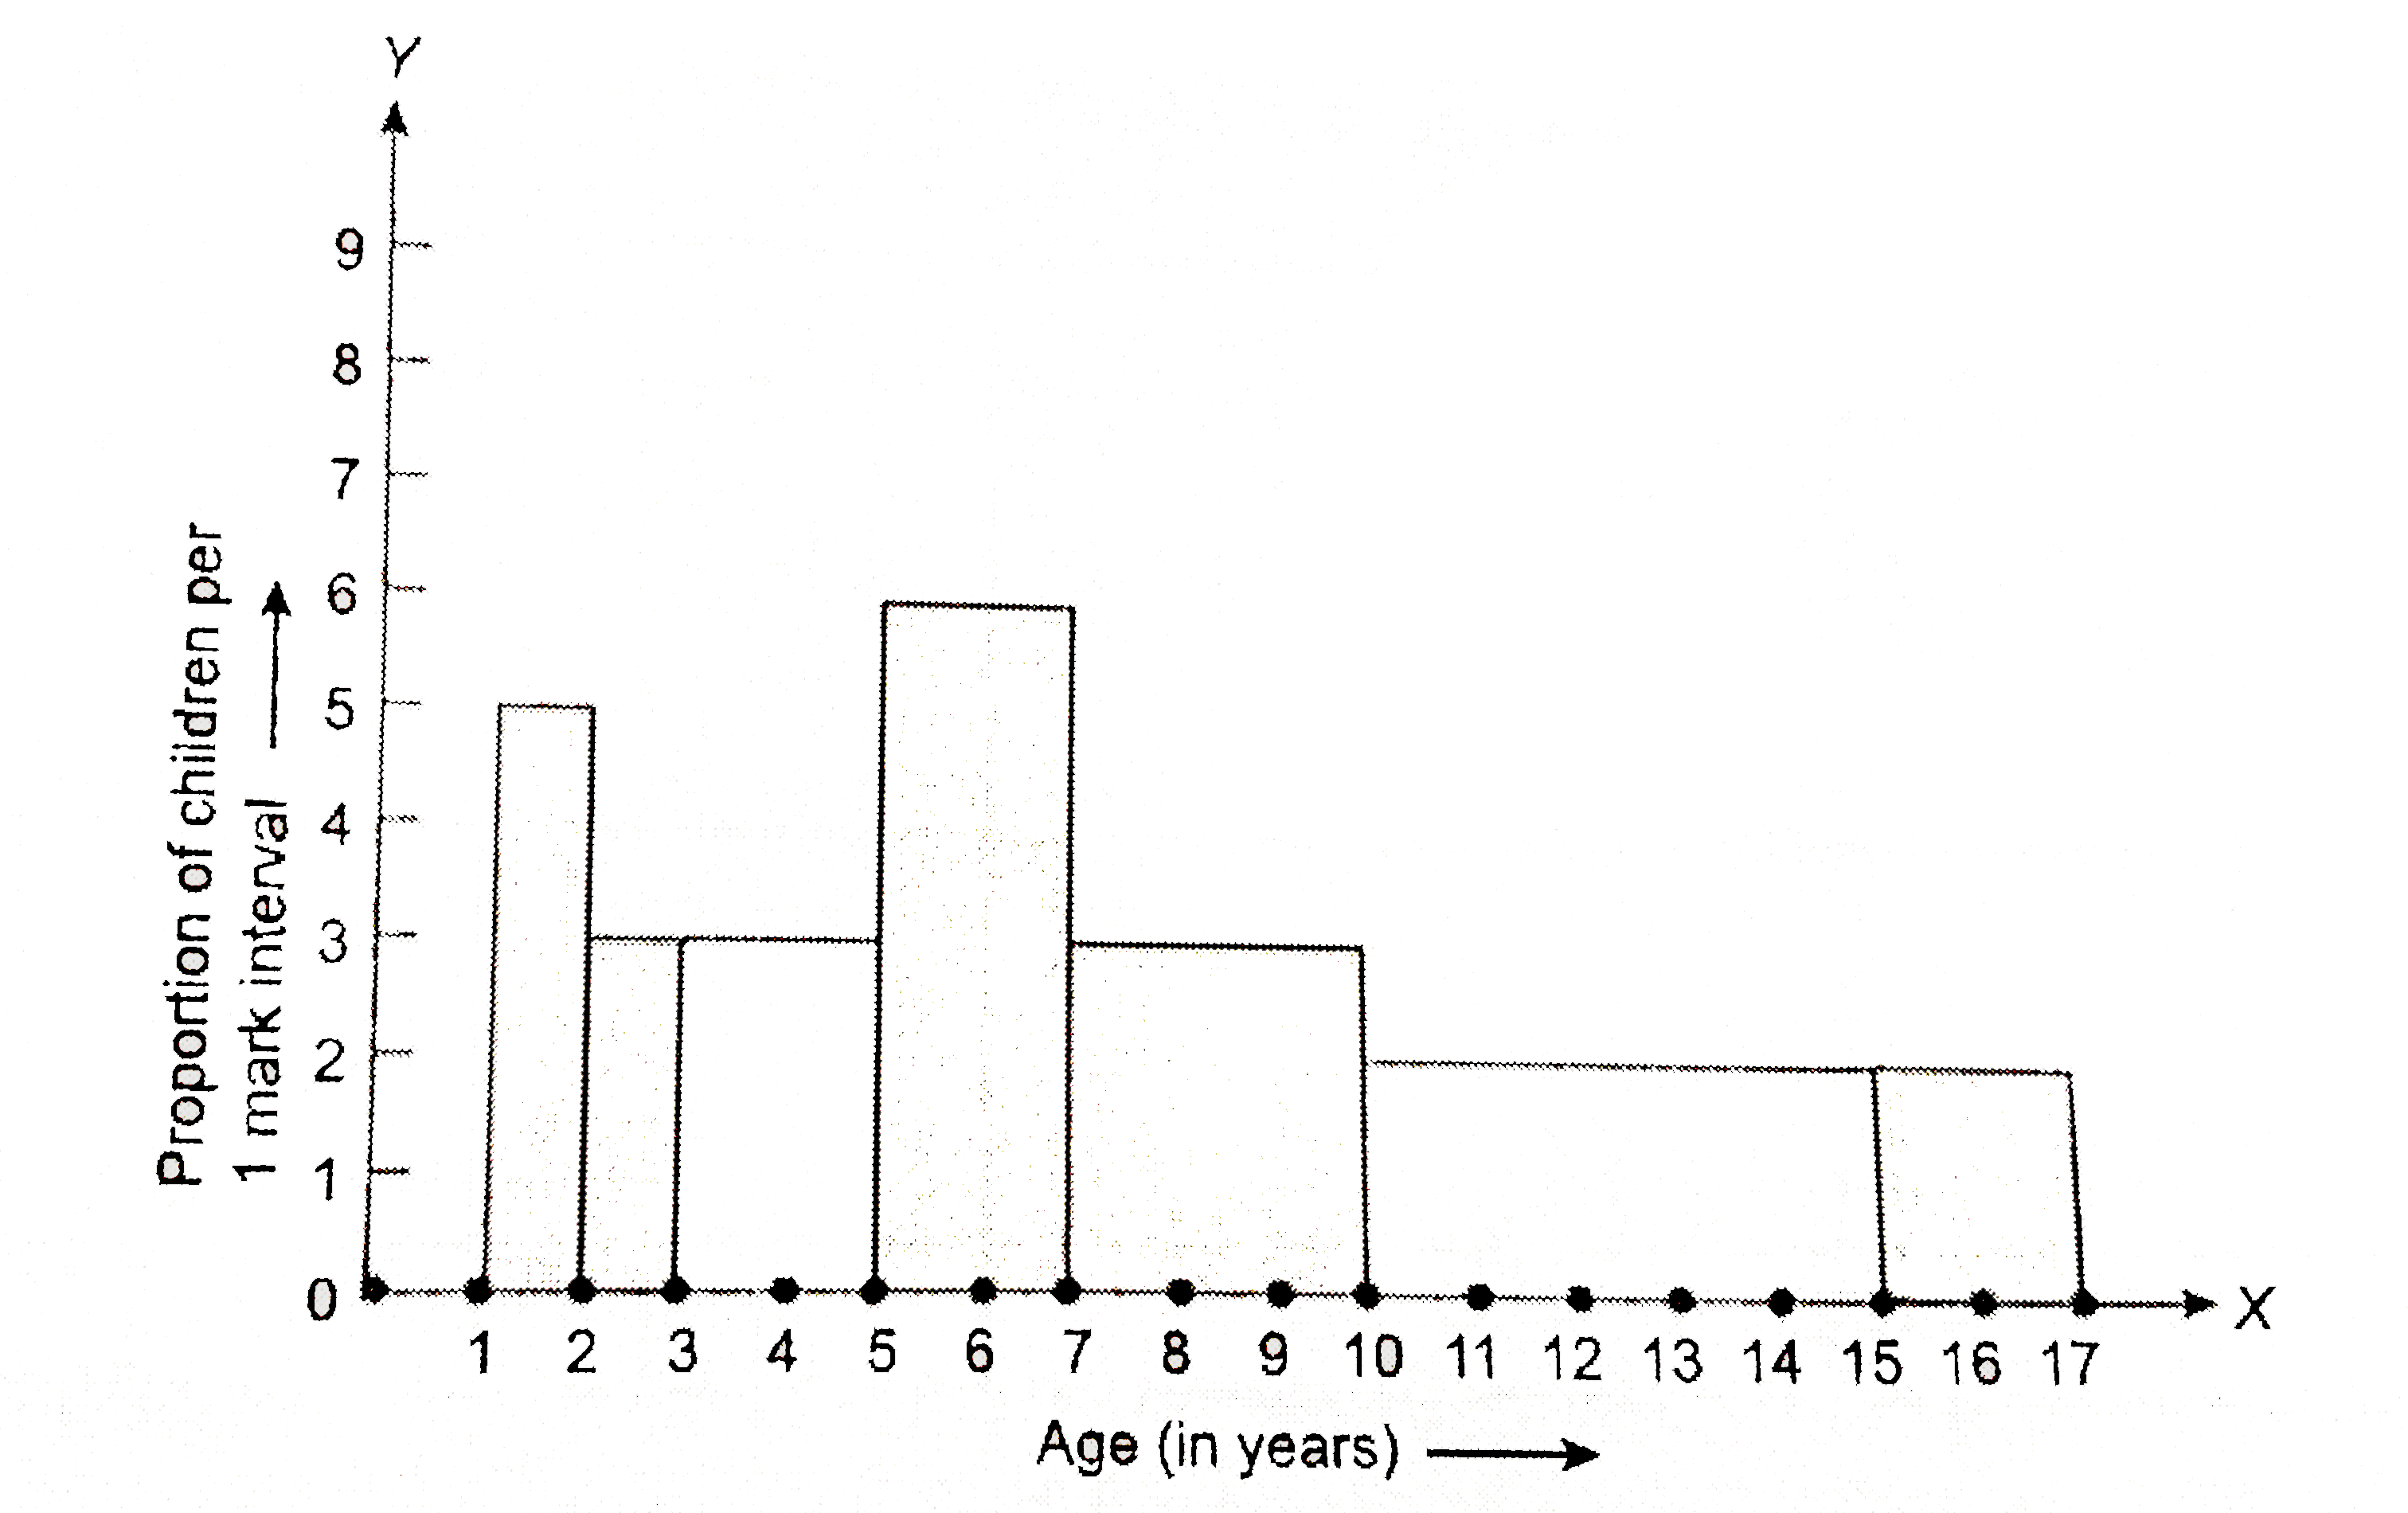
|
|