Saved Bookmarks
| 1. |
Draw a frequency polygon from the following data, giving the age of doctors working in C.G.H.S. in a city. |
Answer» Solution :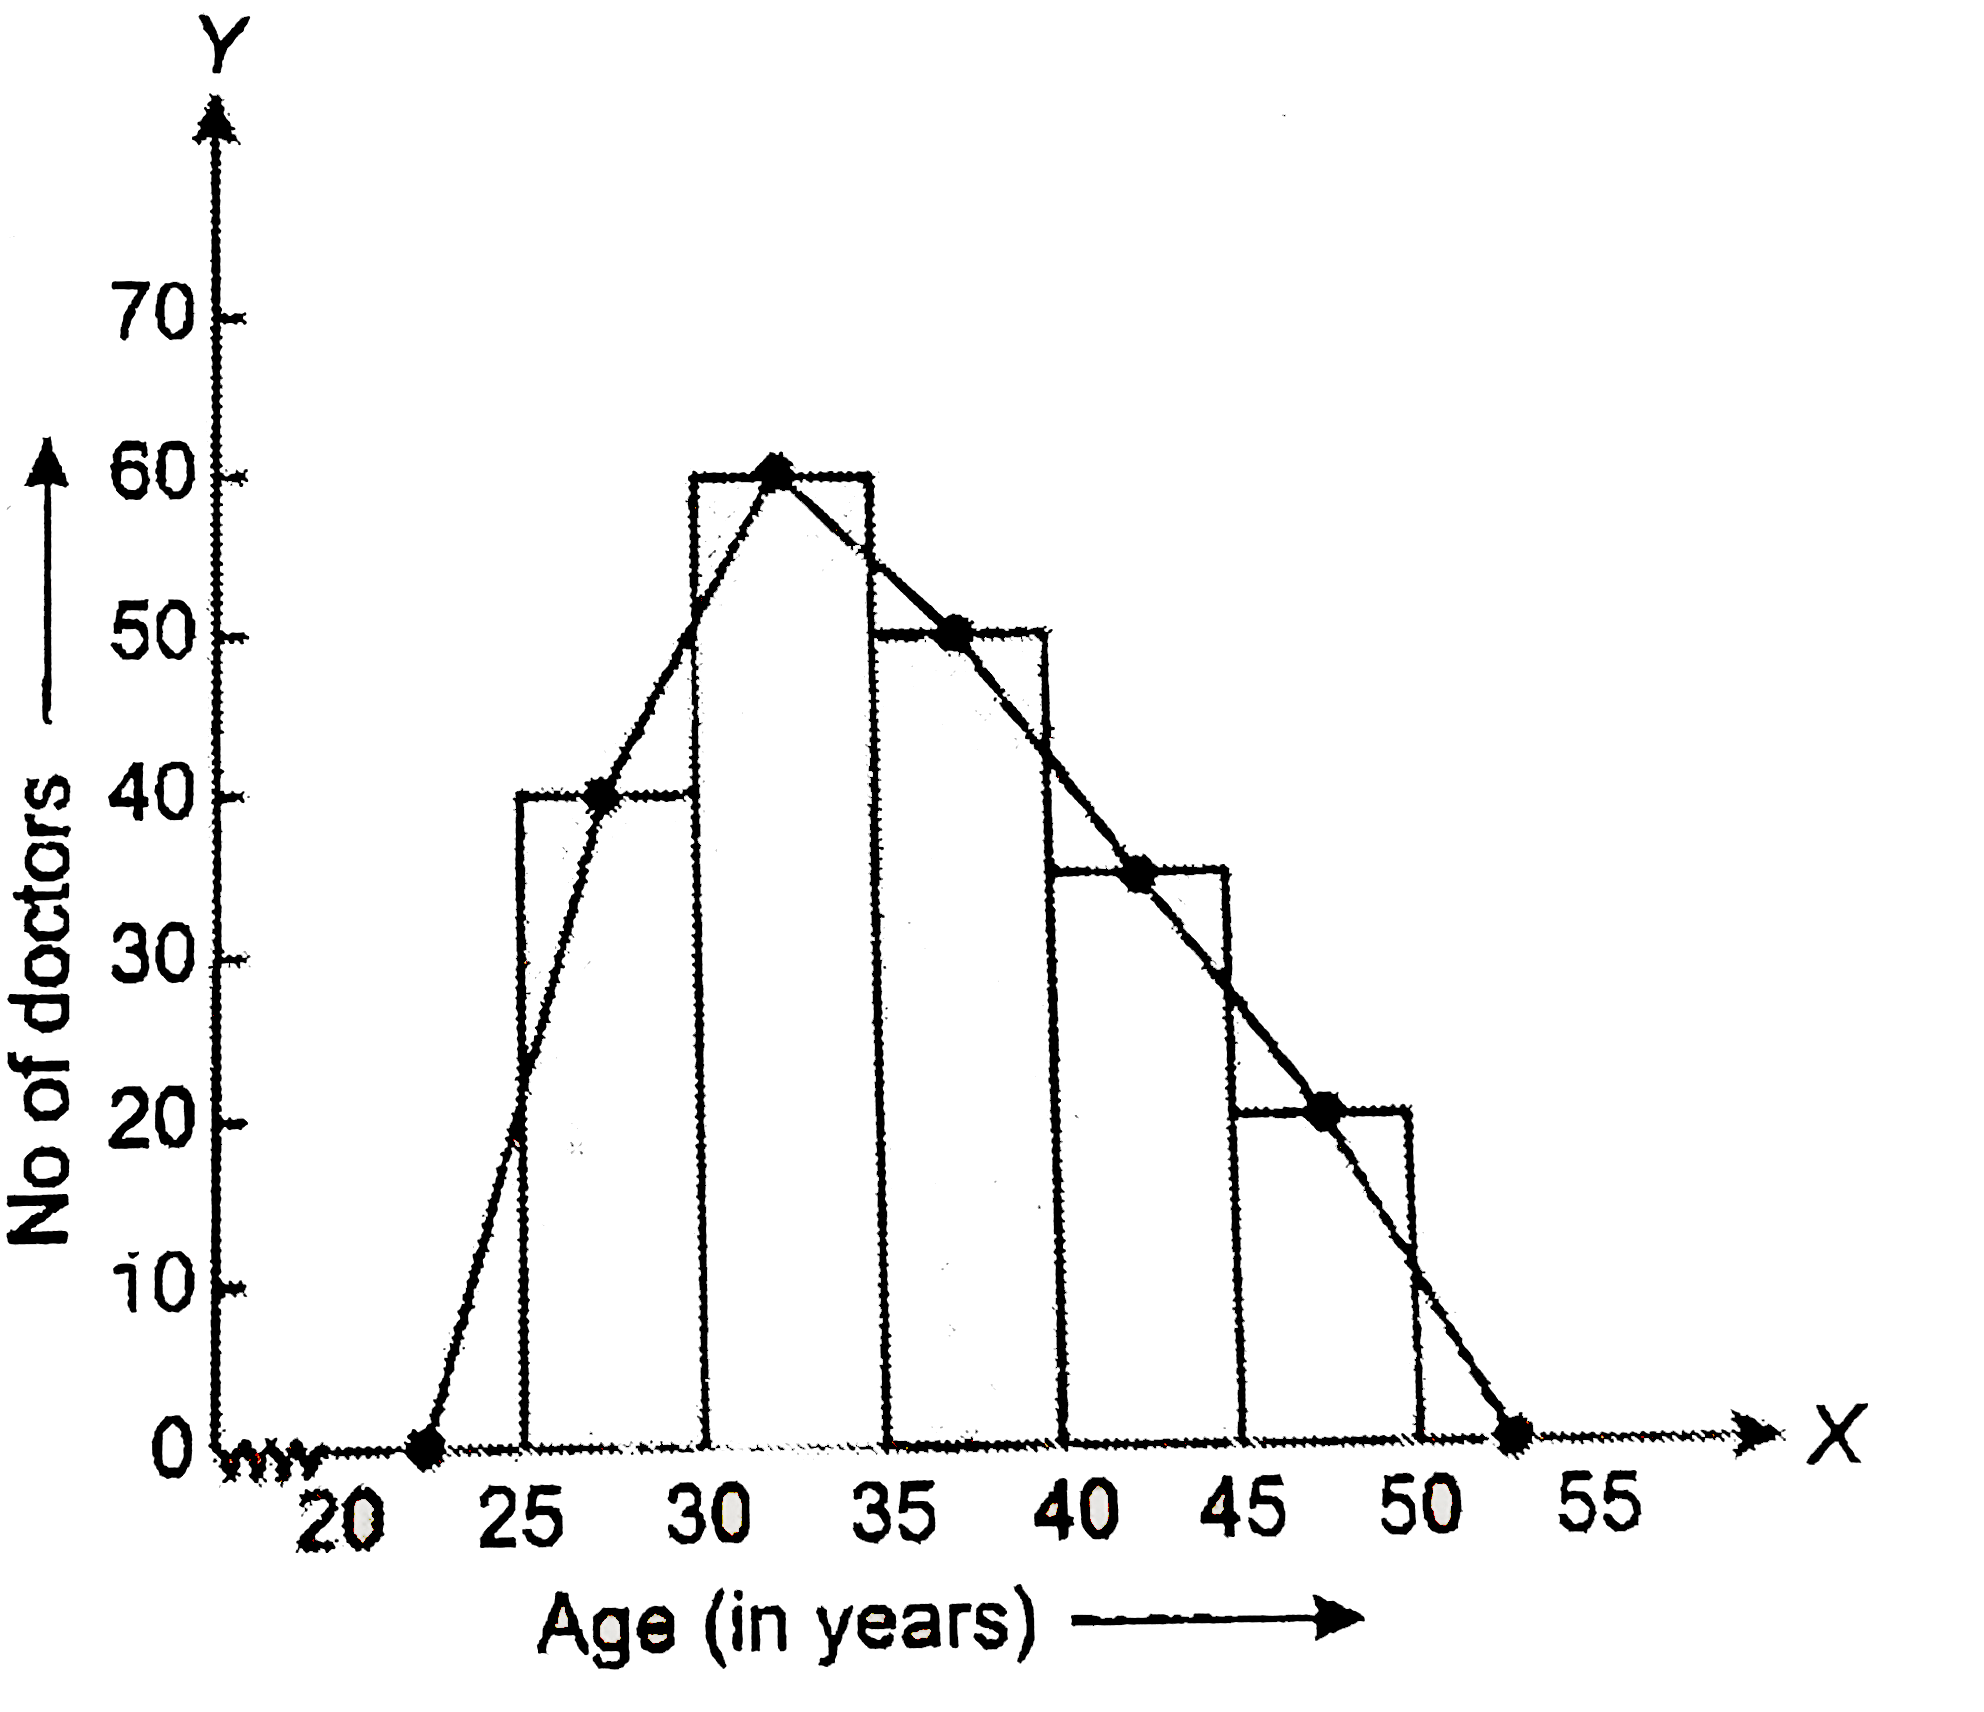 The required frequency polygon is shown in the FOLLOWING figure: STEPS: 1. Draw a histogram for the given data. 2. Mark the mid-point at the top of each rectangle of the histogram drawn. 3. Also, mark the mid-point of the immediately lower class-interval (in the given EXAMPLE, the immediately lower class-interval is (20-25) and mid-point of the immediately HIGHER class-interval (in the given example the immediate upper class-interval is 50-55) 4. Join the consecutive mid-points marked by straight lines to OBTAIN the required frequency polygon. |
|