Saved Bookmarks
| 1. |
Draw a histogram for the marks of students given below: |
|
Answer» Solution :Here, MINIMUM class-size = 5. So, we adjust the frequencies by USING the following formula: Adjusted frequency of a class `="Minimum class-size"/"calss-size" xx "frequency of the class"` The adjusted frequencies are COMPUTED as FOLLOWS: 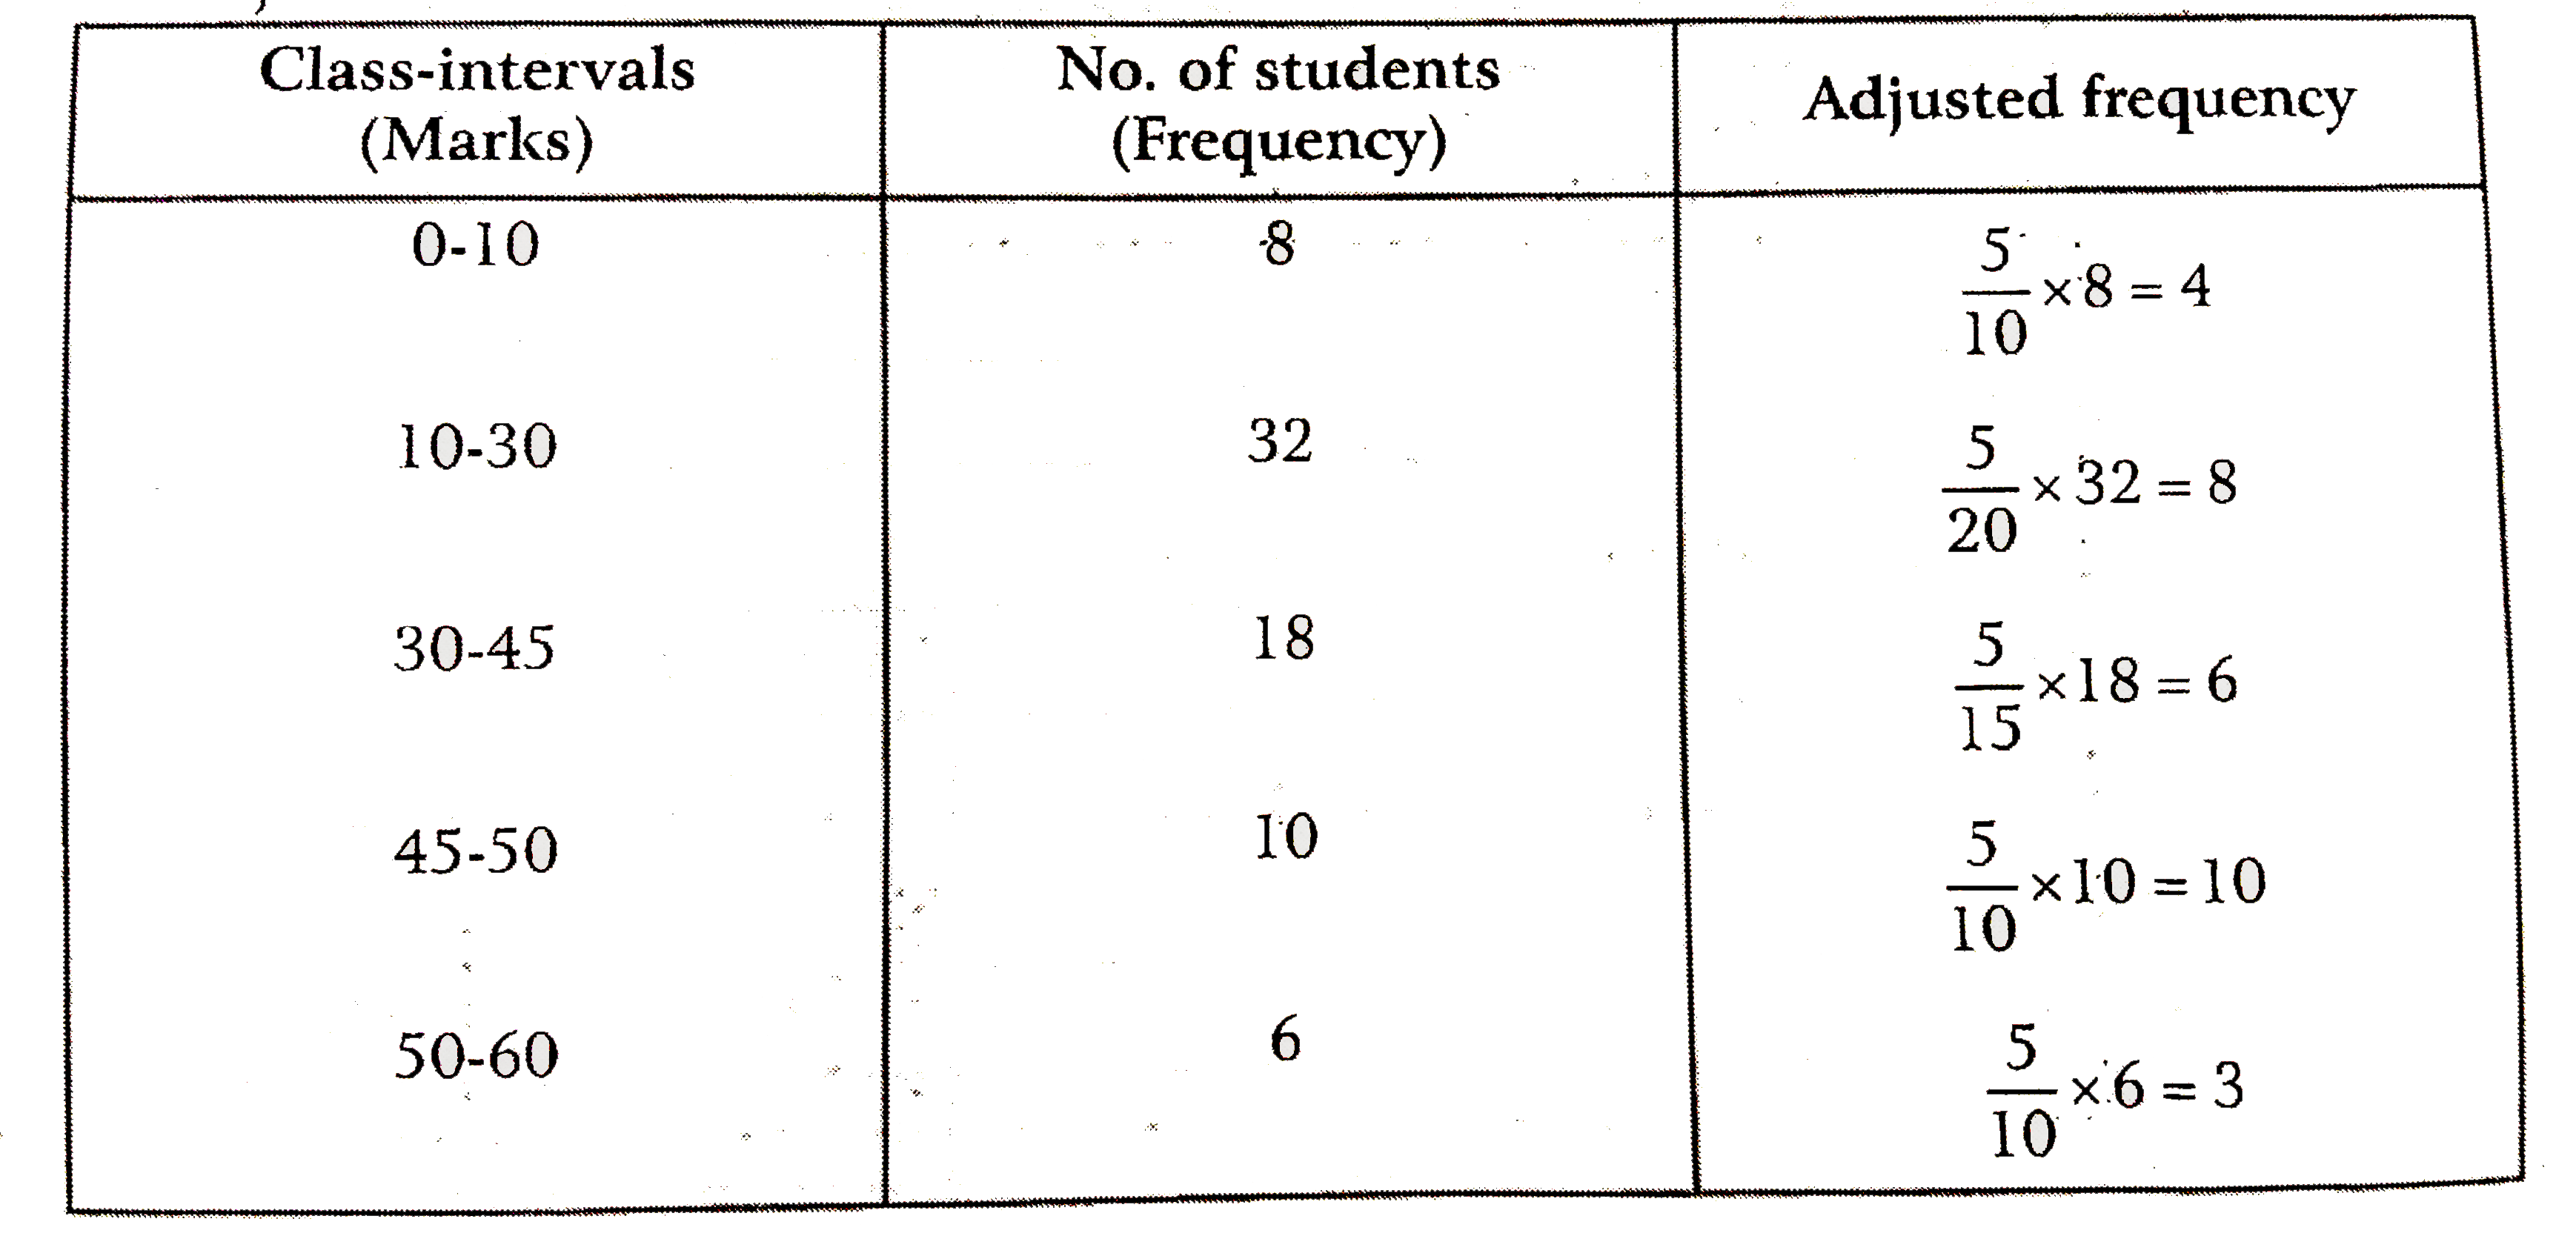 Now, we construct rectangles with class-limits as bases and RESPECTIVE adjusted frequencies as heights. 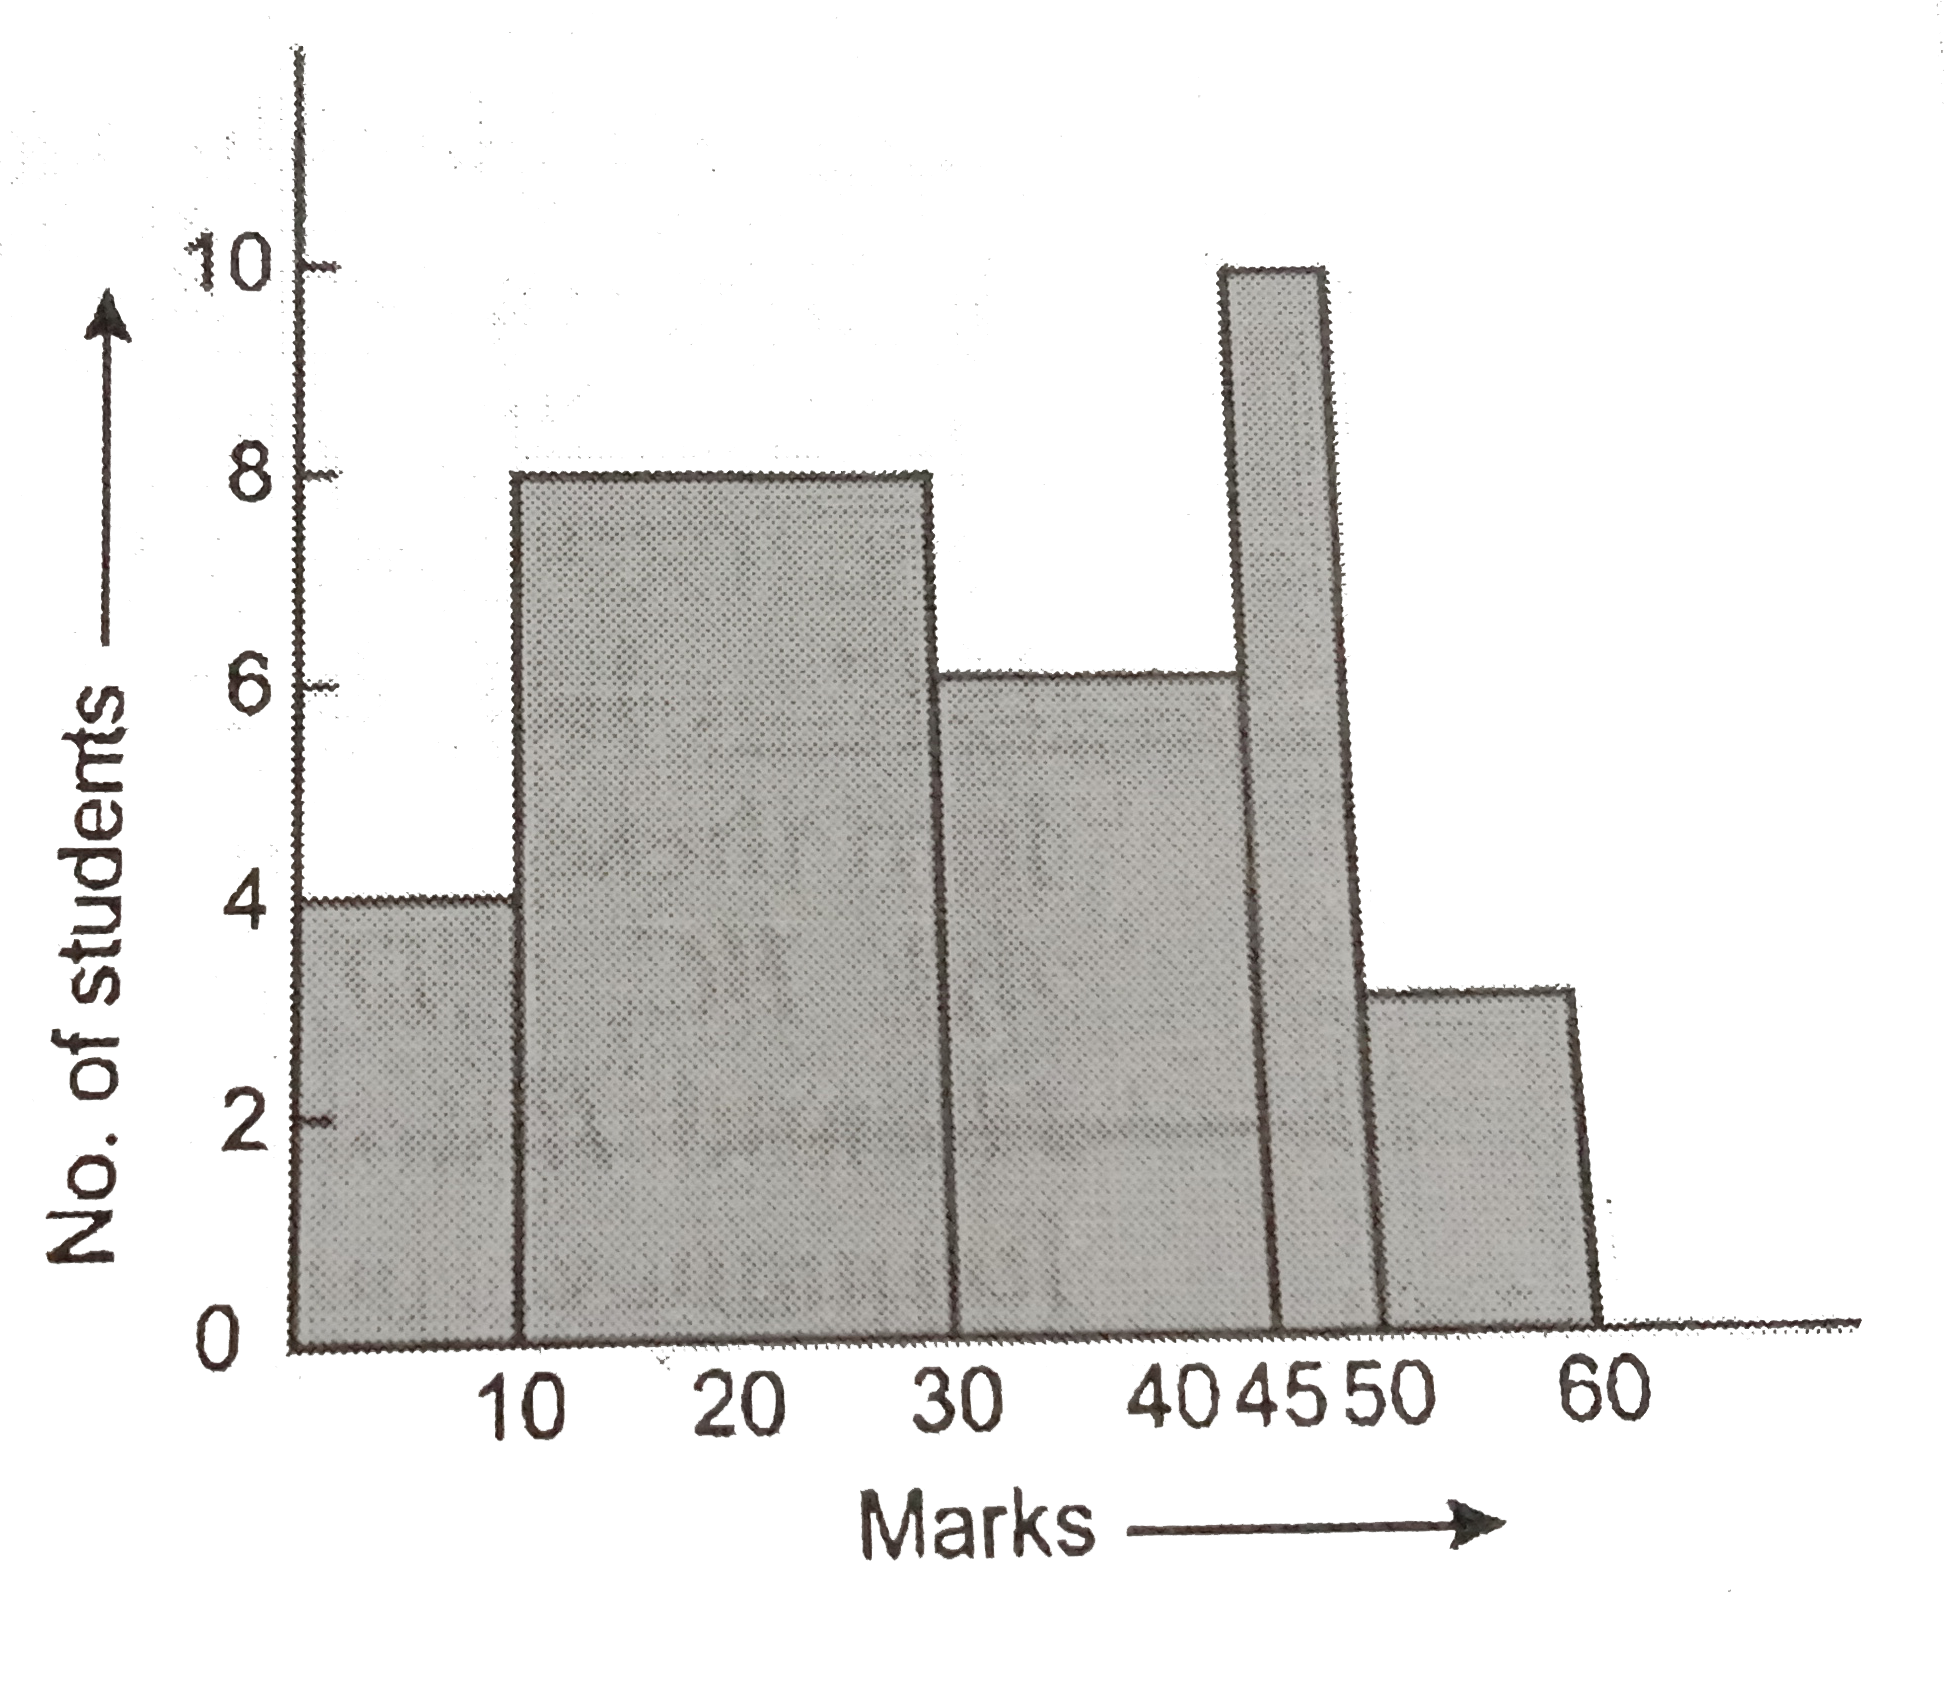
|
|