Saved Bookmarks
| 1. |
Draw a histogram from the following data: |
Answer» Solution :Given table is in the INCLUSIVE form. First we will convert it into the exclusive form. So the frequency table in the exclusive form is as follows: 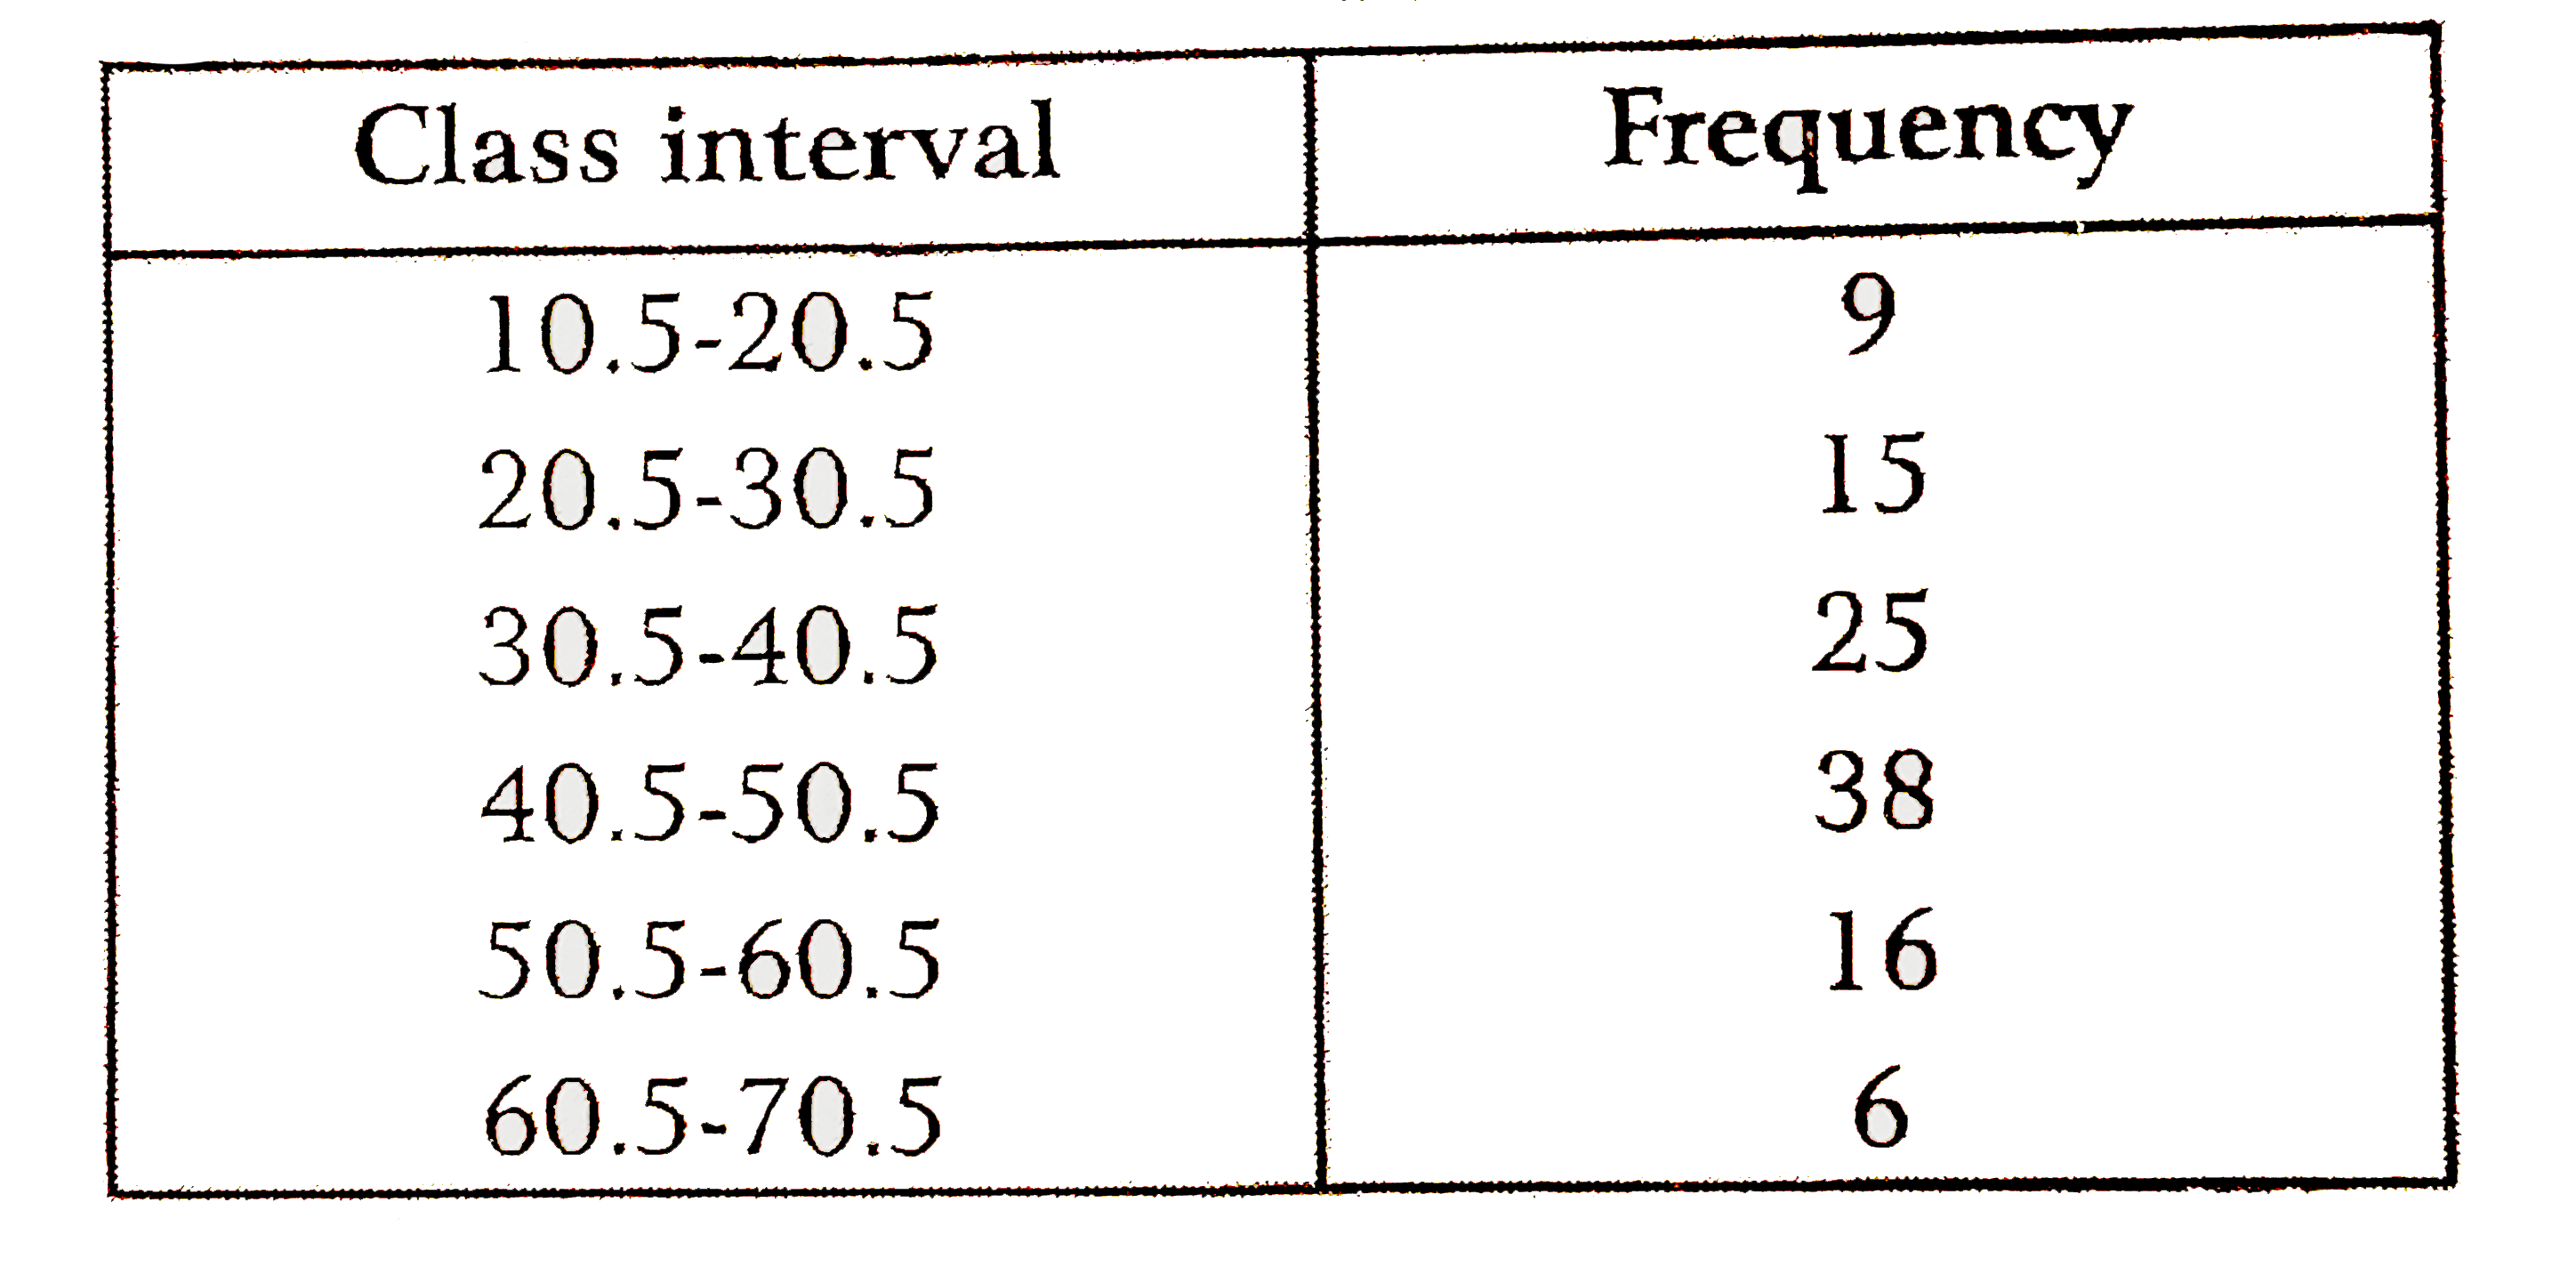 Scale : LET 1 cm = 10 units on X-axis 1 cm = 5 units on Y-axis 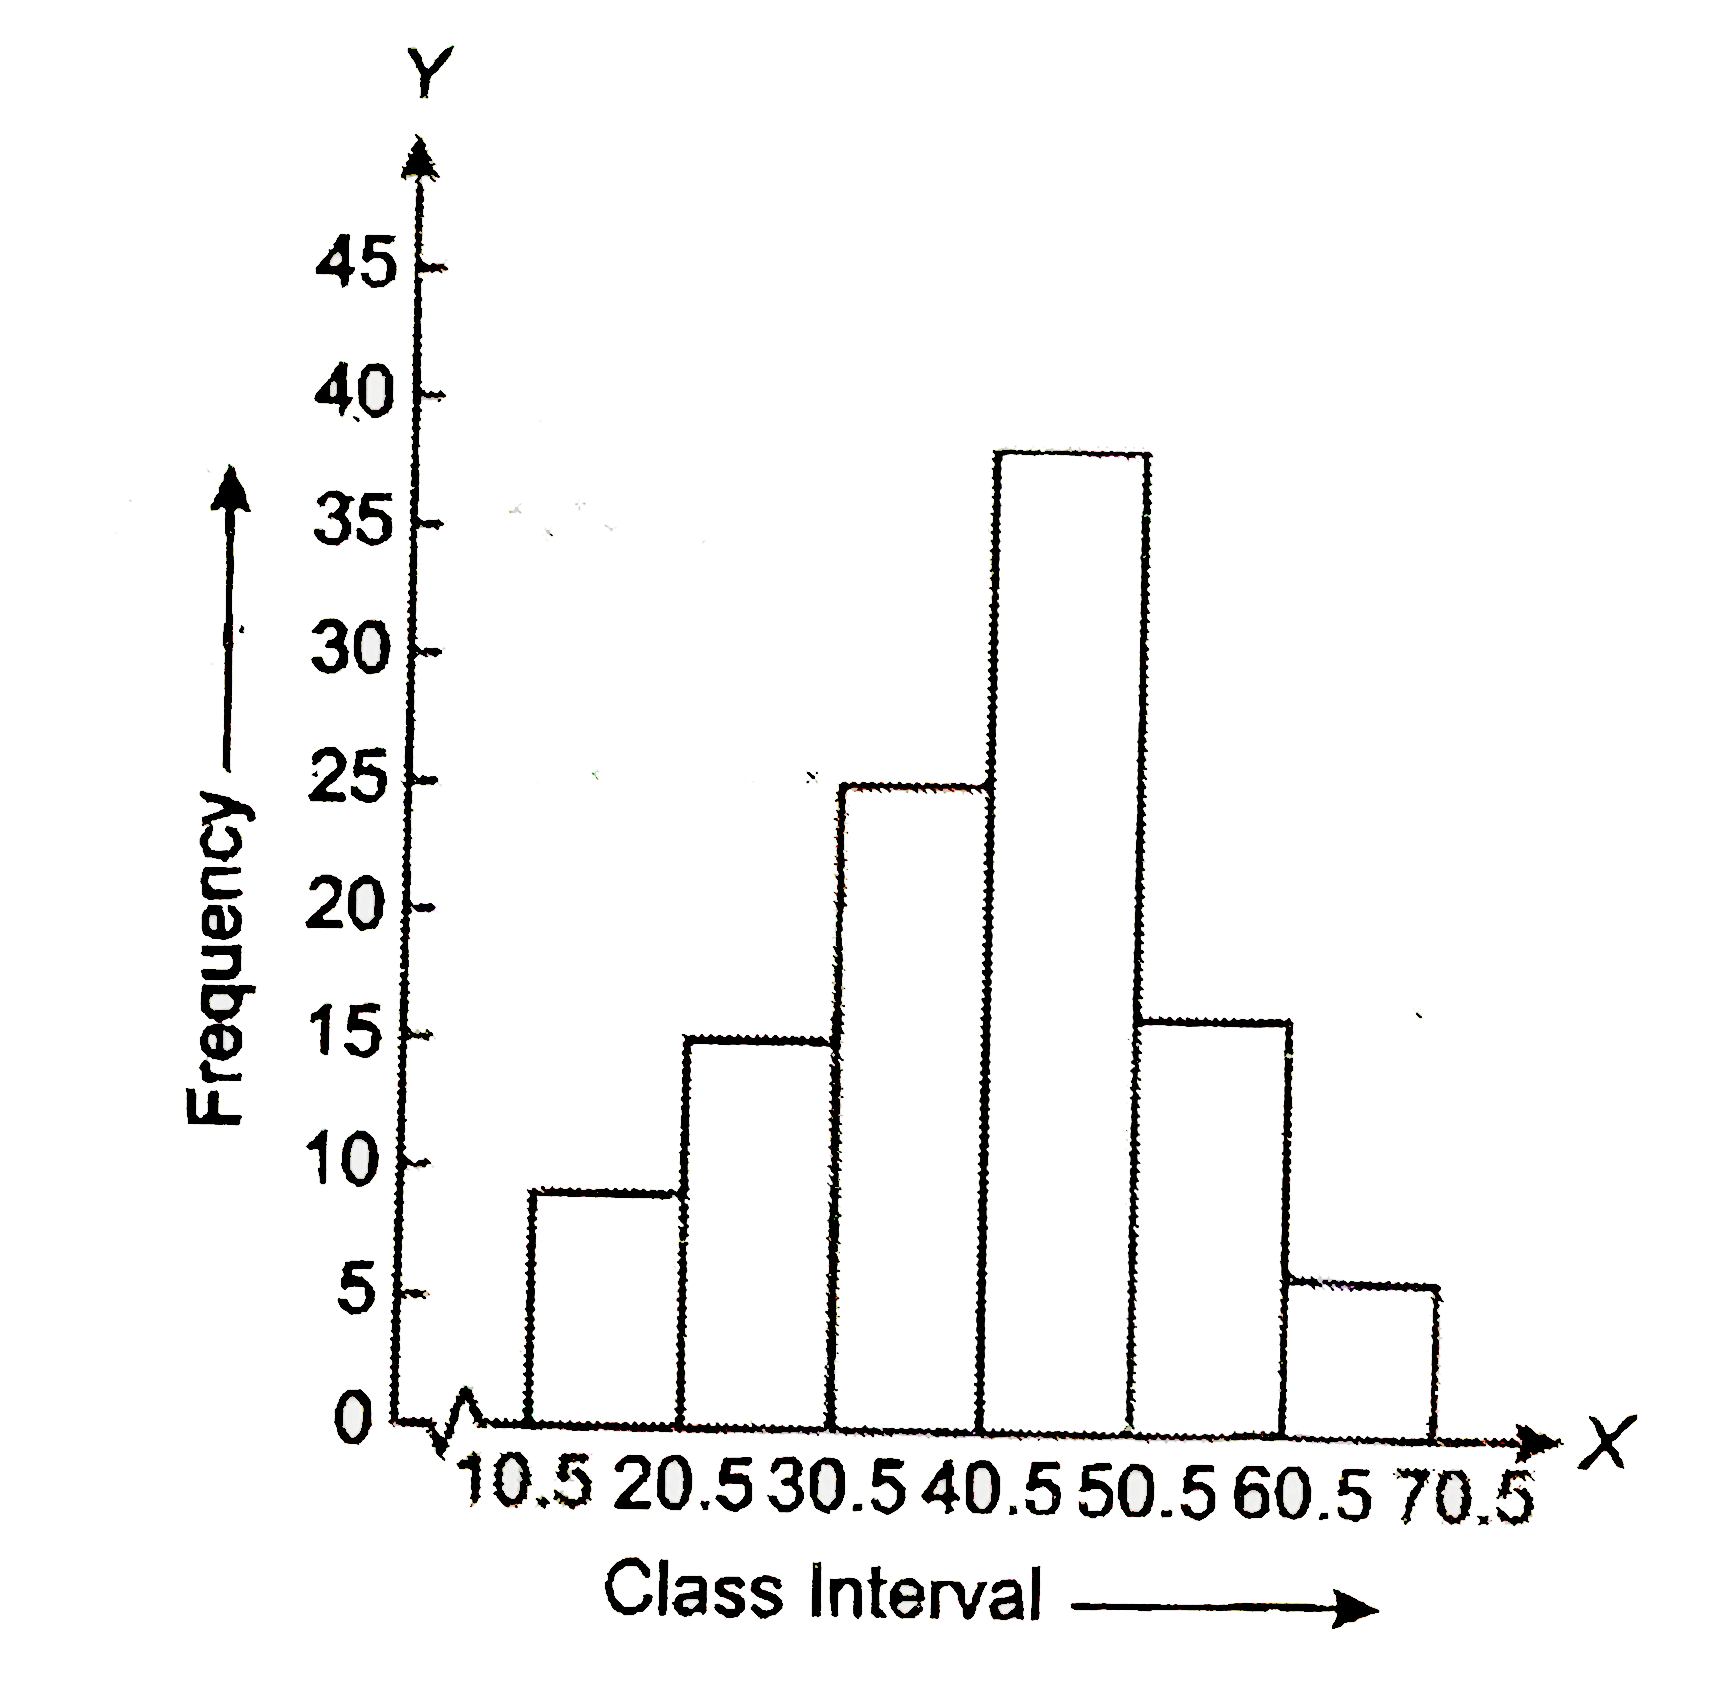
|
|