Saved Bookmarks
| 1. |
Draw a histogram to represent the following: |
|
Answer» Solution :Scale: Let 1 CM = 6 units on X-axis 1 cm = 5 units on Y-axis Here, the CLASS intervals starts from 30, a zig-zag CURVE is shown from 0 to 30 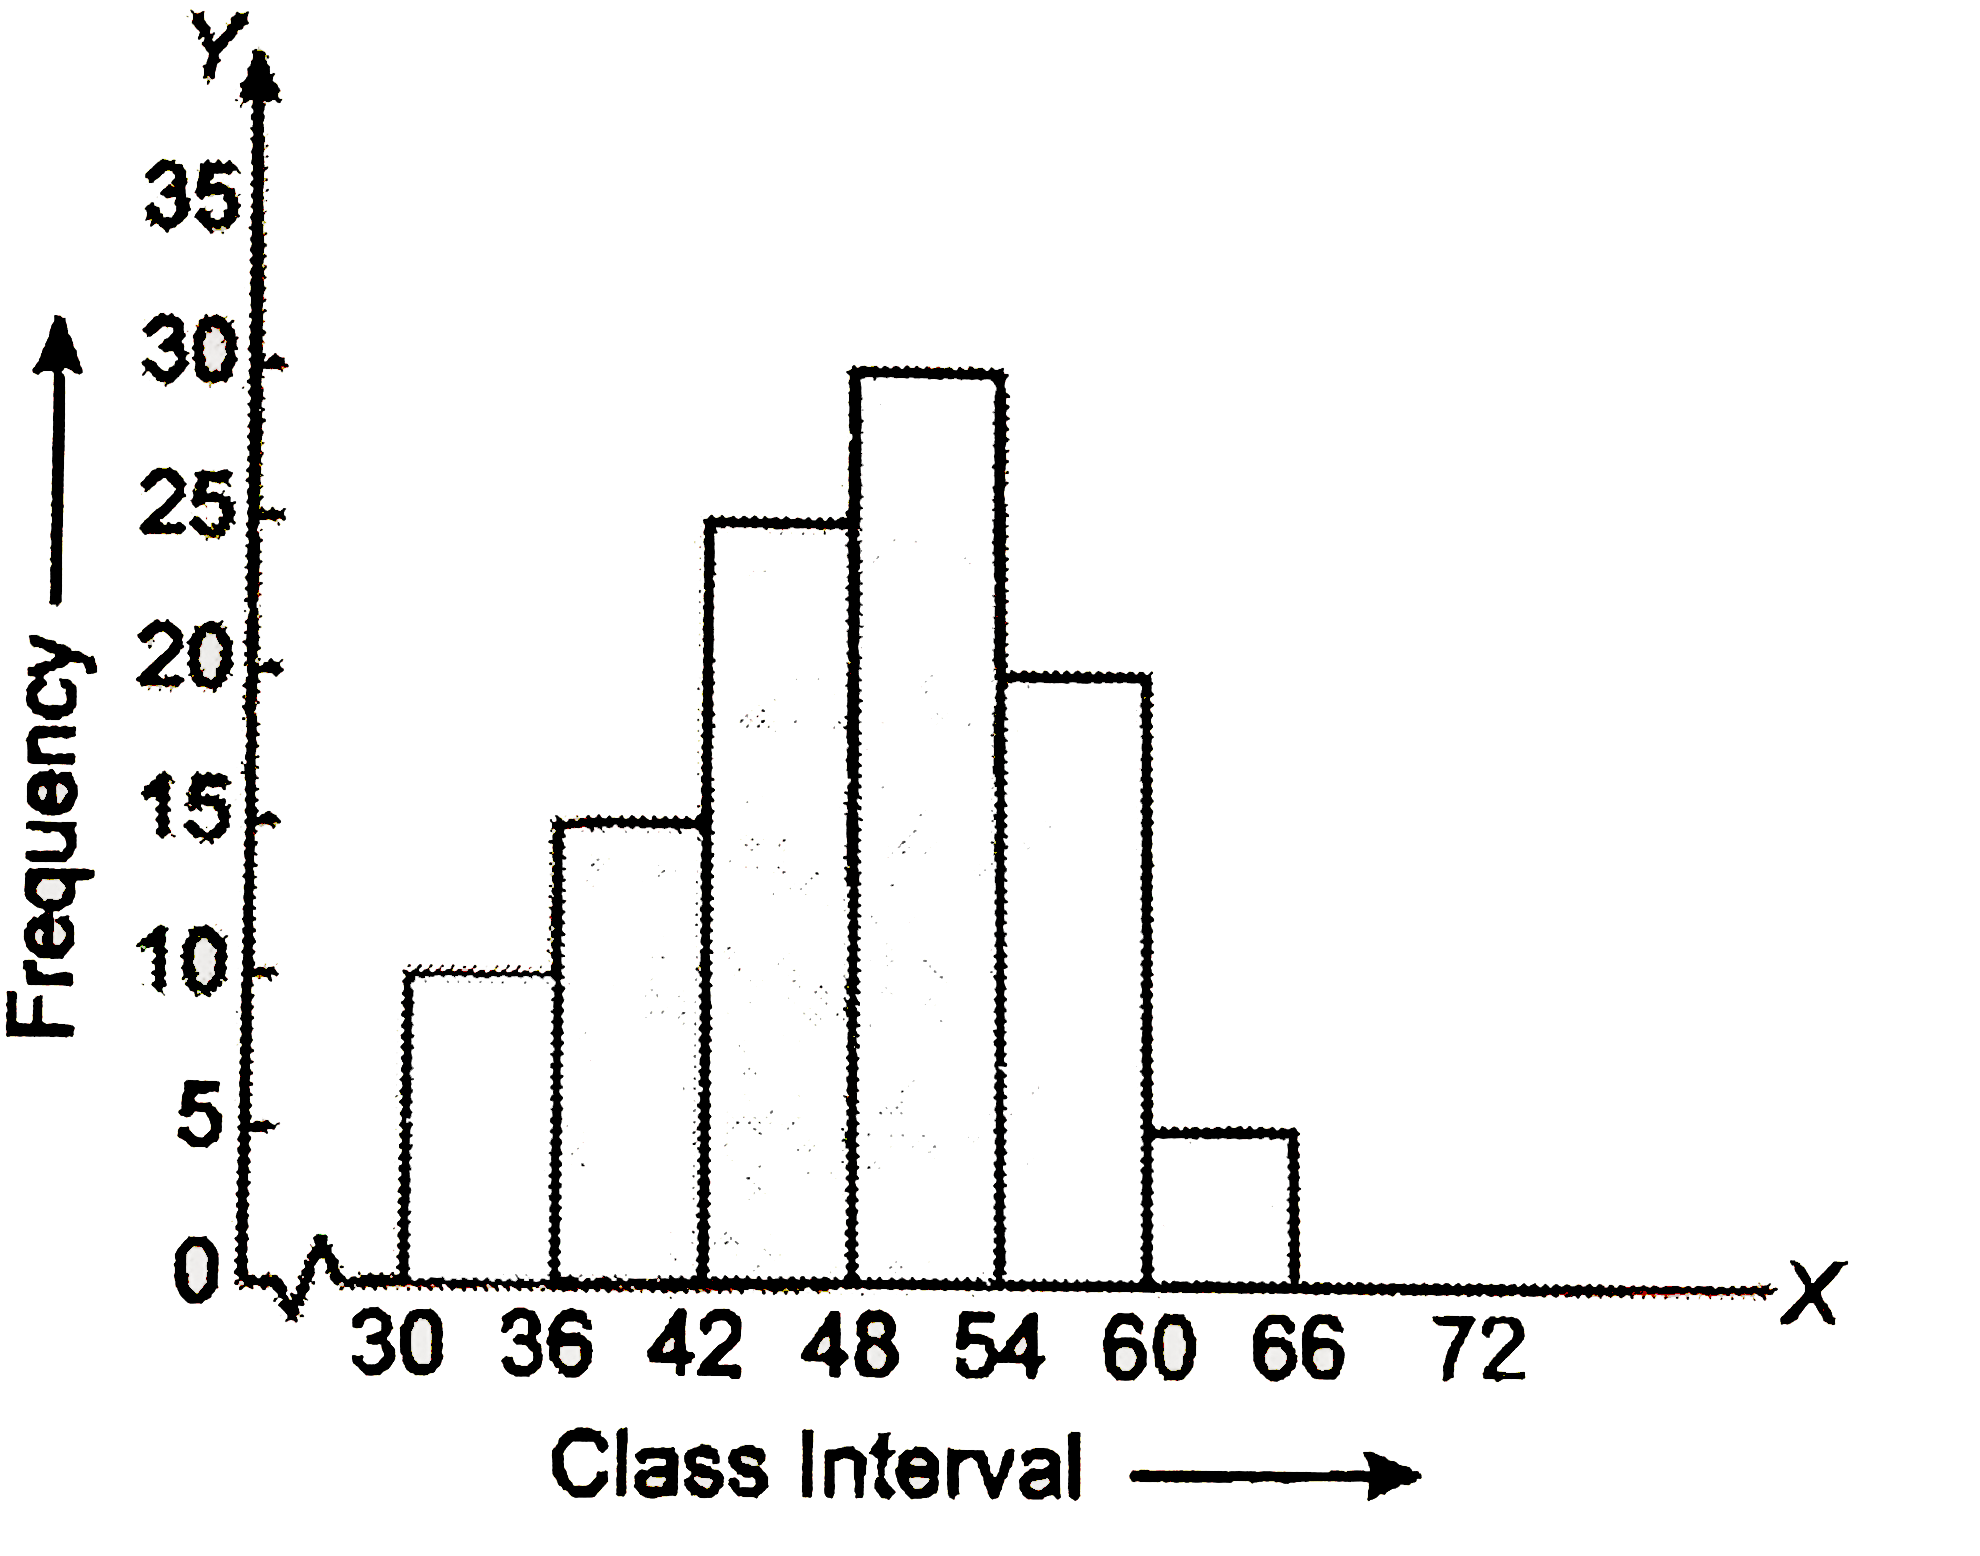
|
|