Saved Bookmarks
| 1. |
Refer to Q. 7. Draw the frequency polygon representing the above data without drawing the histogram. |
|
Answer» Solution :We have to draw a frequency polygon without a HISTOGRAM. Firstly, we find the class marks of the classes given that is 30-40, 40-50, 50-60, 60-70…….. `therefore` The class mark `=(30+40)/2` `=70/2=35` Similarly, we can DETERMINE the class marks of other classes. So, table for class marks is shown below. 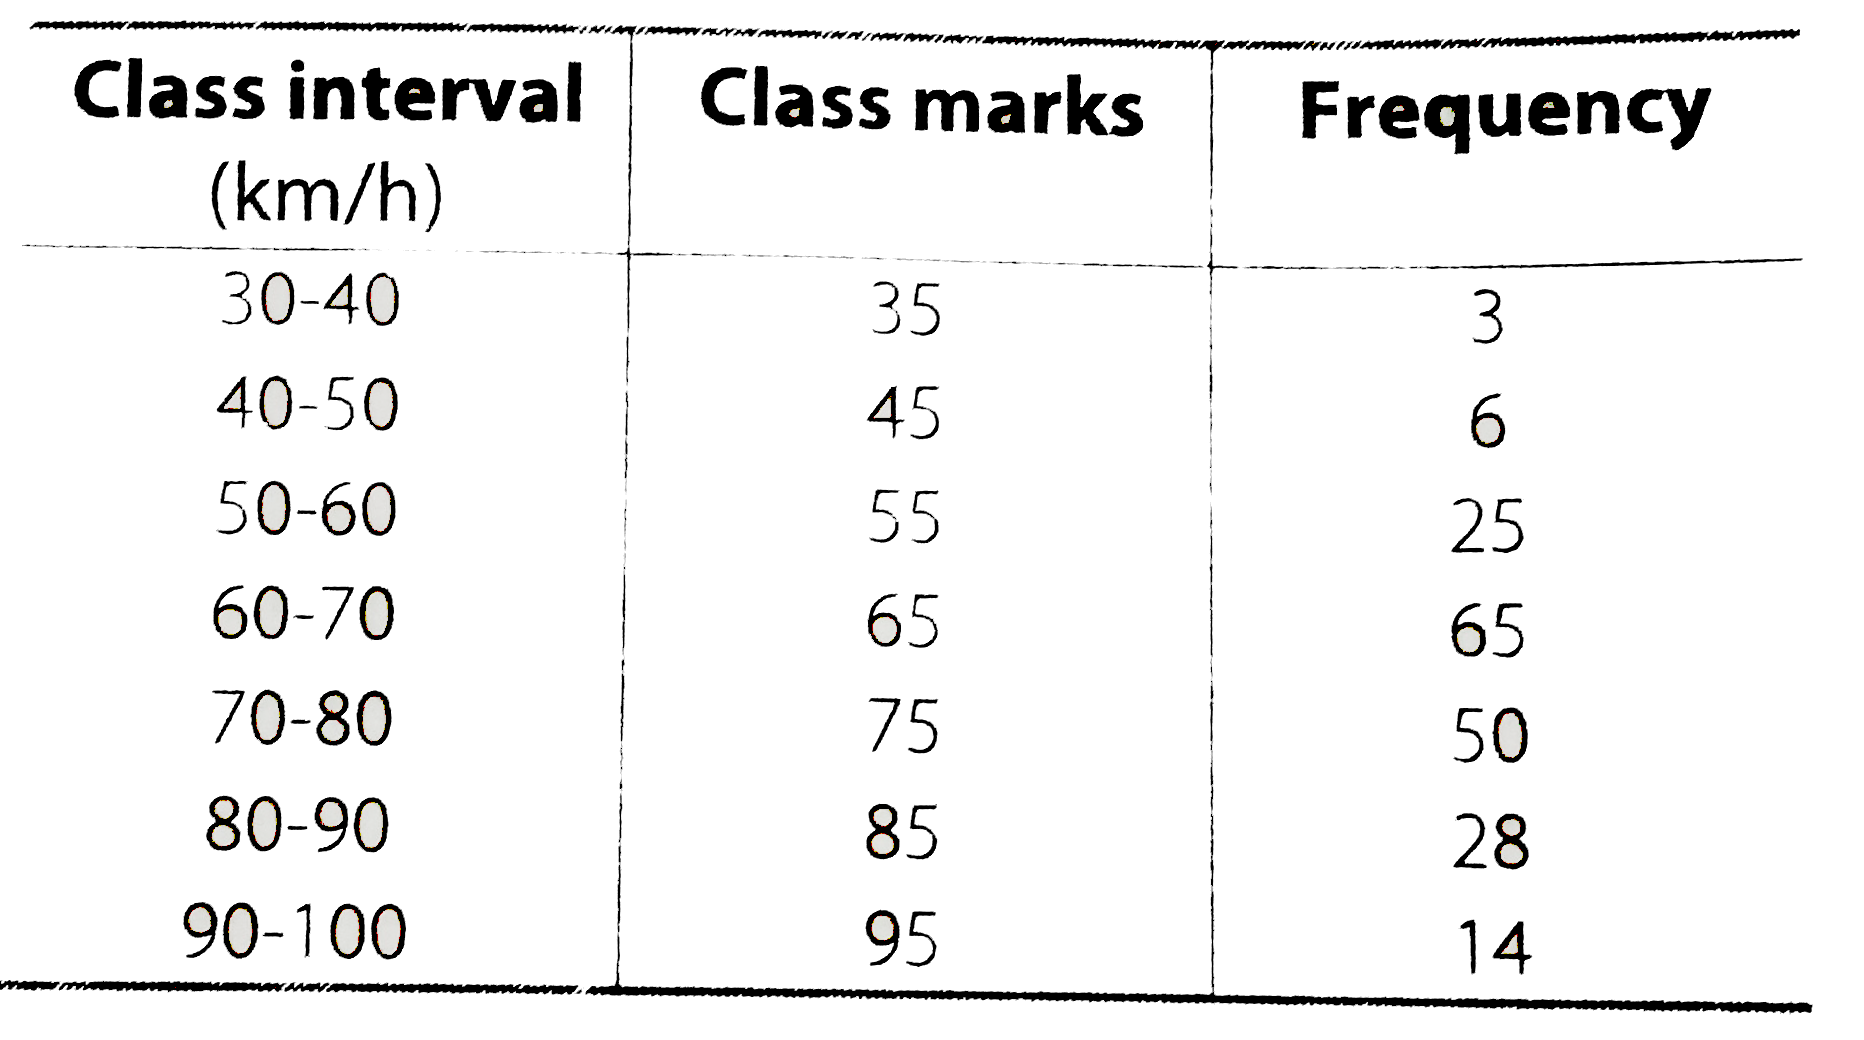 We can draw a frequency polygon by PLOTTING the class marks along the horizontal axis and the frequency along the vertical axis. Now, plotting all the points B (35,3), C(45,6), D(55,25), E(65,65), F(75,50), G(85,28), H(95,14), also plot the point corresponding to the considering classes 20-30 and 100-110 each with frequency 0. Join all these point LINE segments. 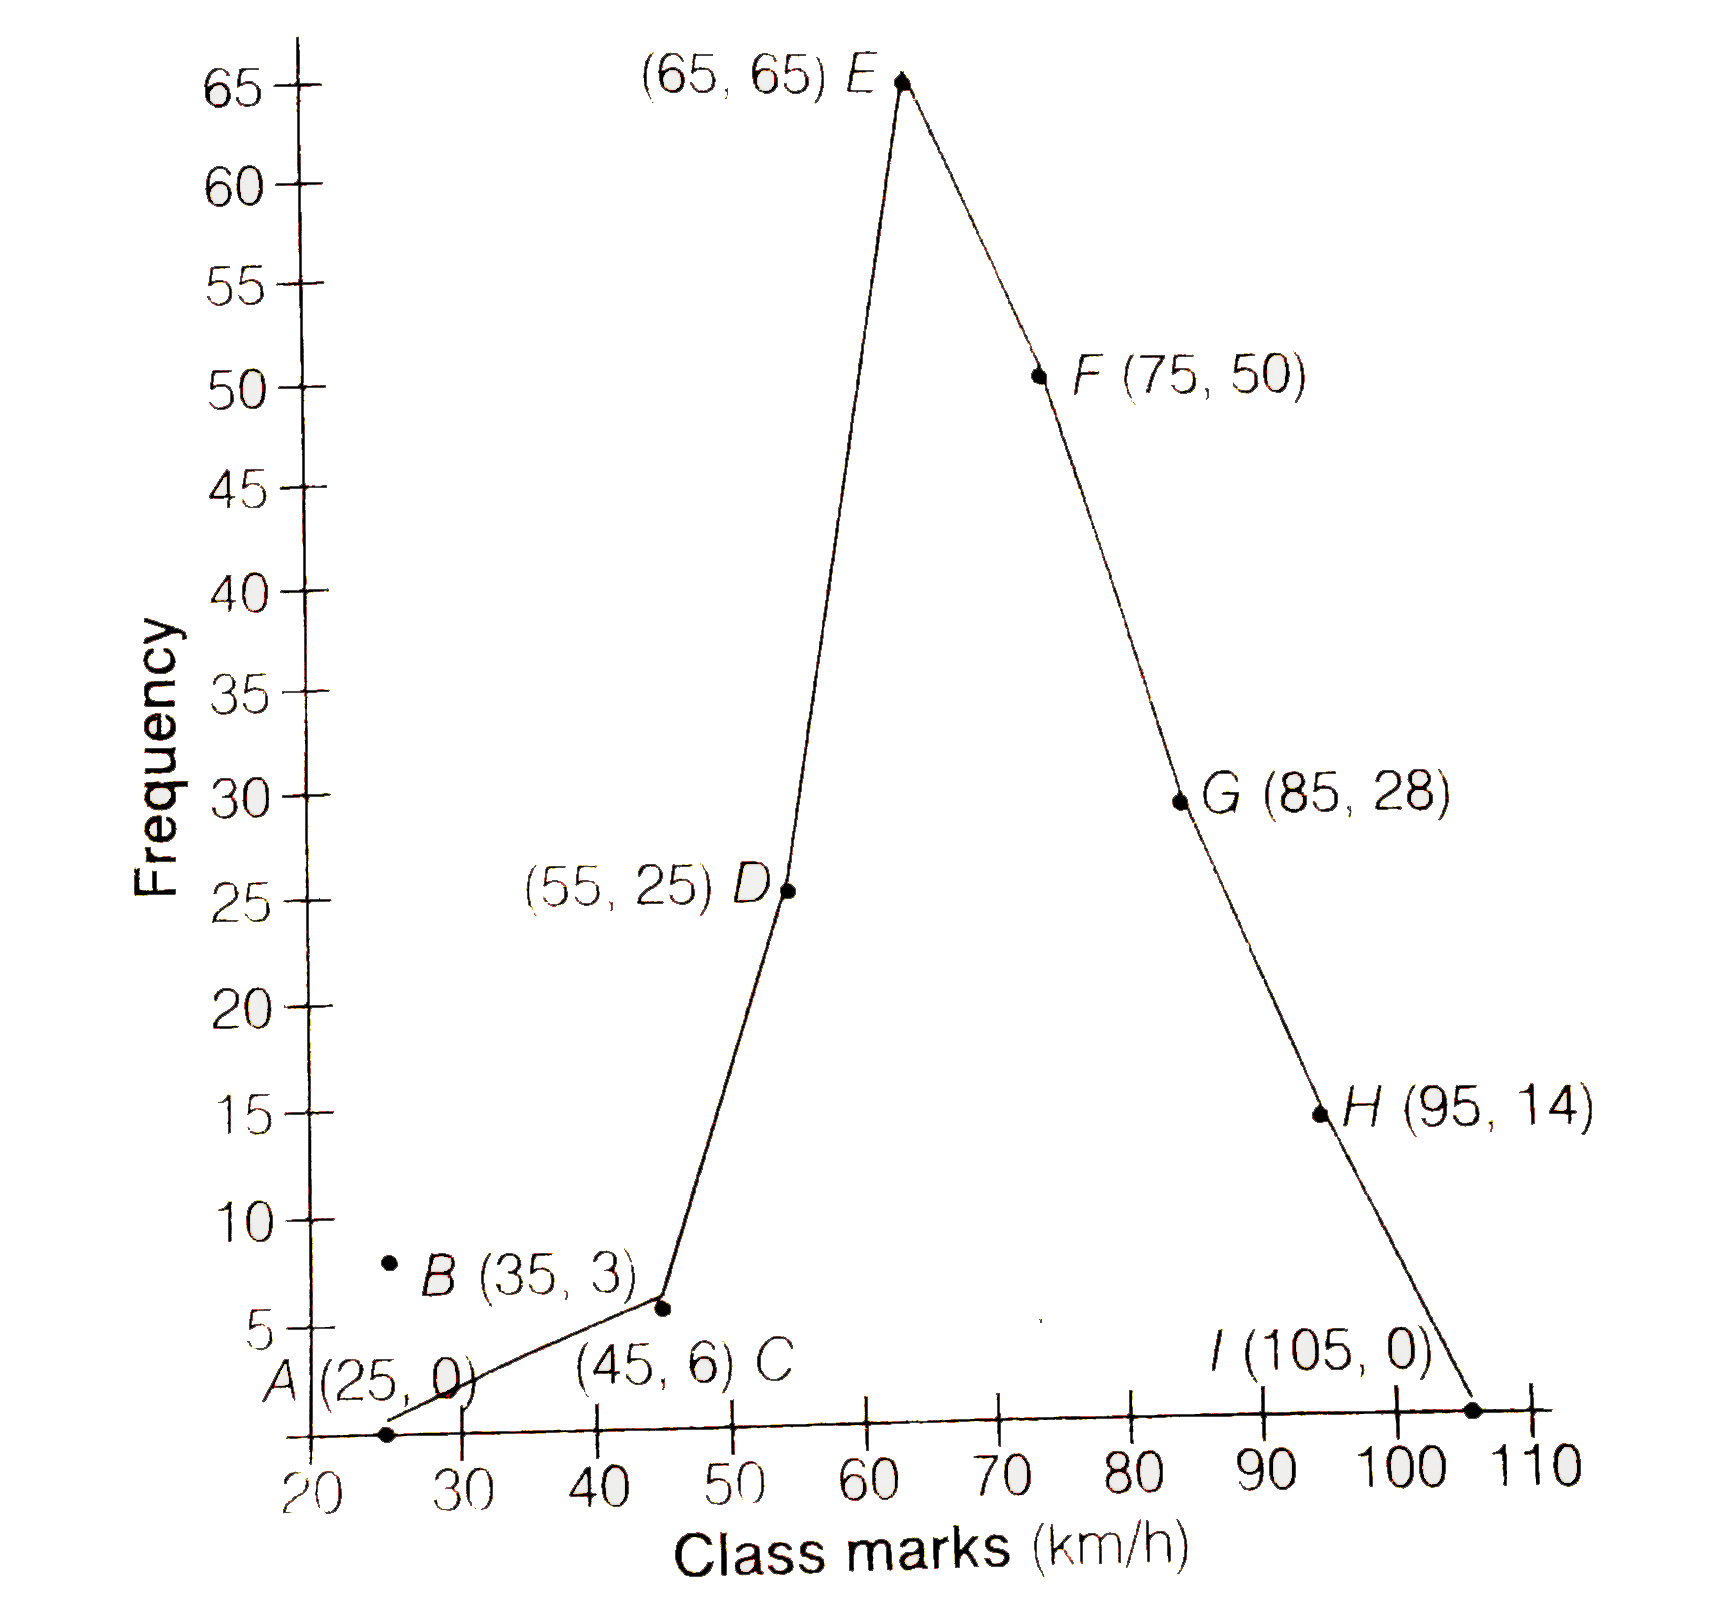
|
|