Saved Bookmarks
| 1. |
The marks obtained (out of 100) by a class of 80 students are given below: Construct a histogram to represent the data above |
|
Answer» SOLUTION :Here, the class INTERVALS are of UNEQUAL WIDTH. So, we shall first input COMPUTE adjusted frequencies of each class. The minimum class-size is 20-10=10. The adjusted frequencies are computed by using the following formula `"Adjusted frequency" = ("minimum class-size")/("class-size") xx "frequency of the class"` 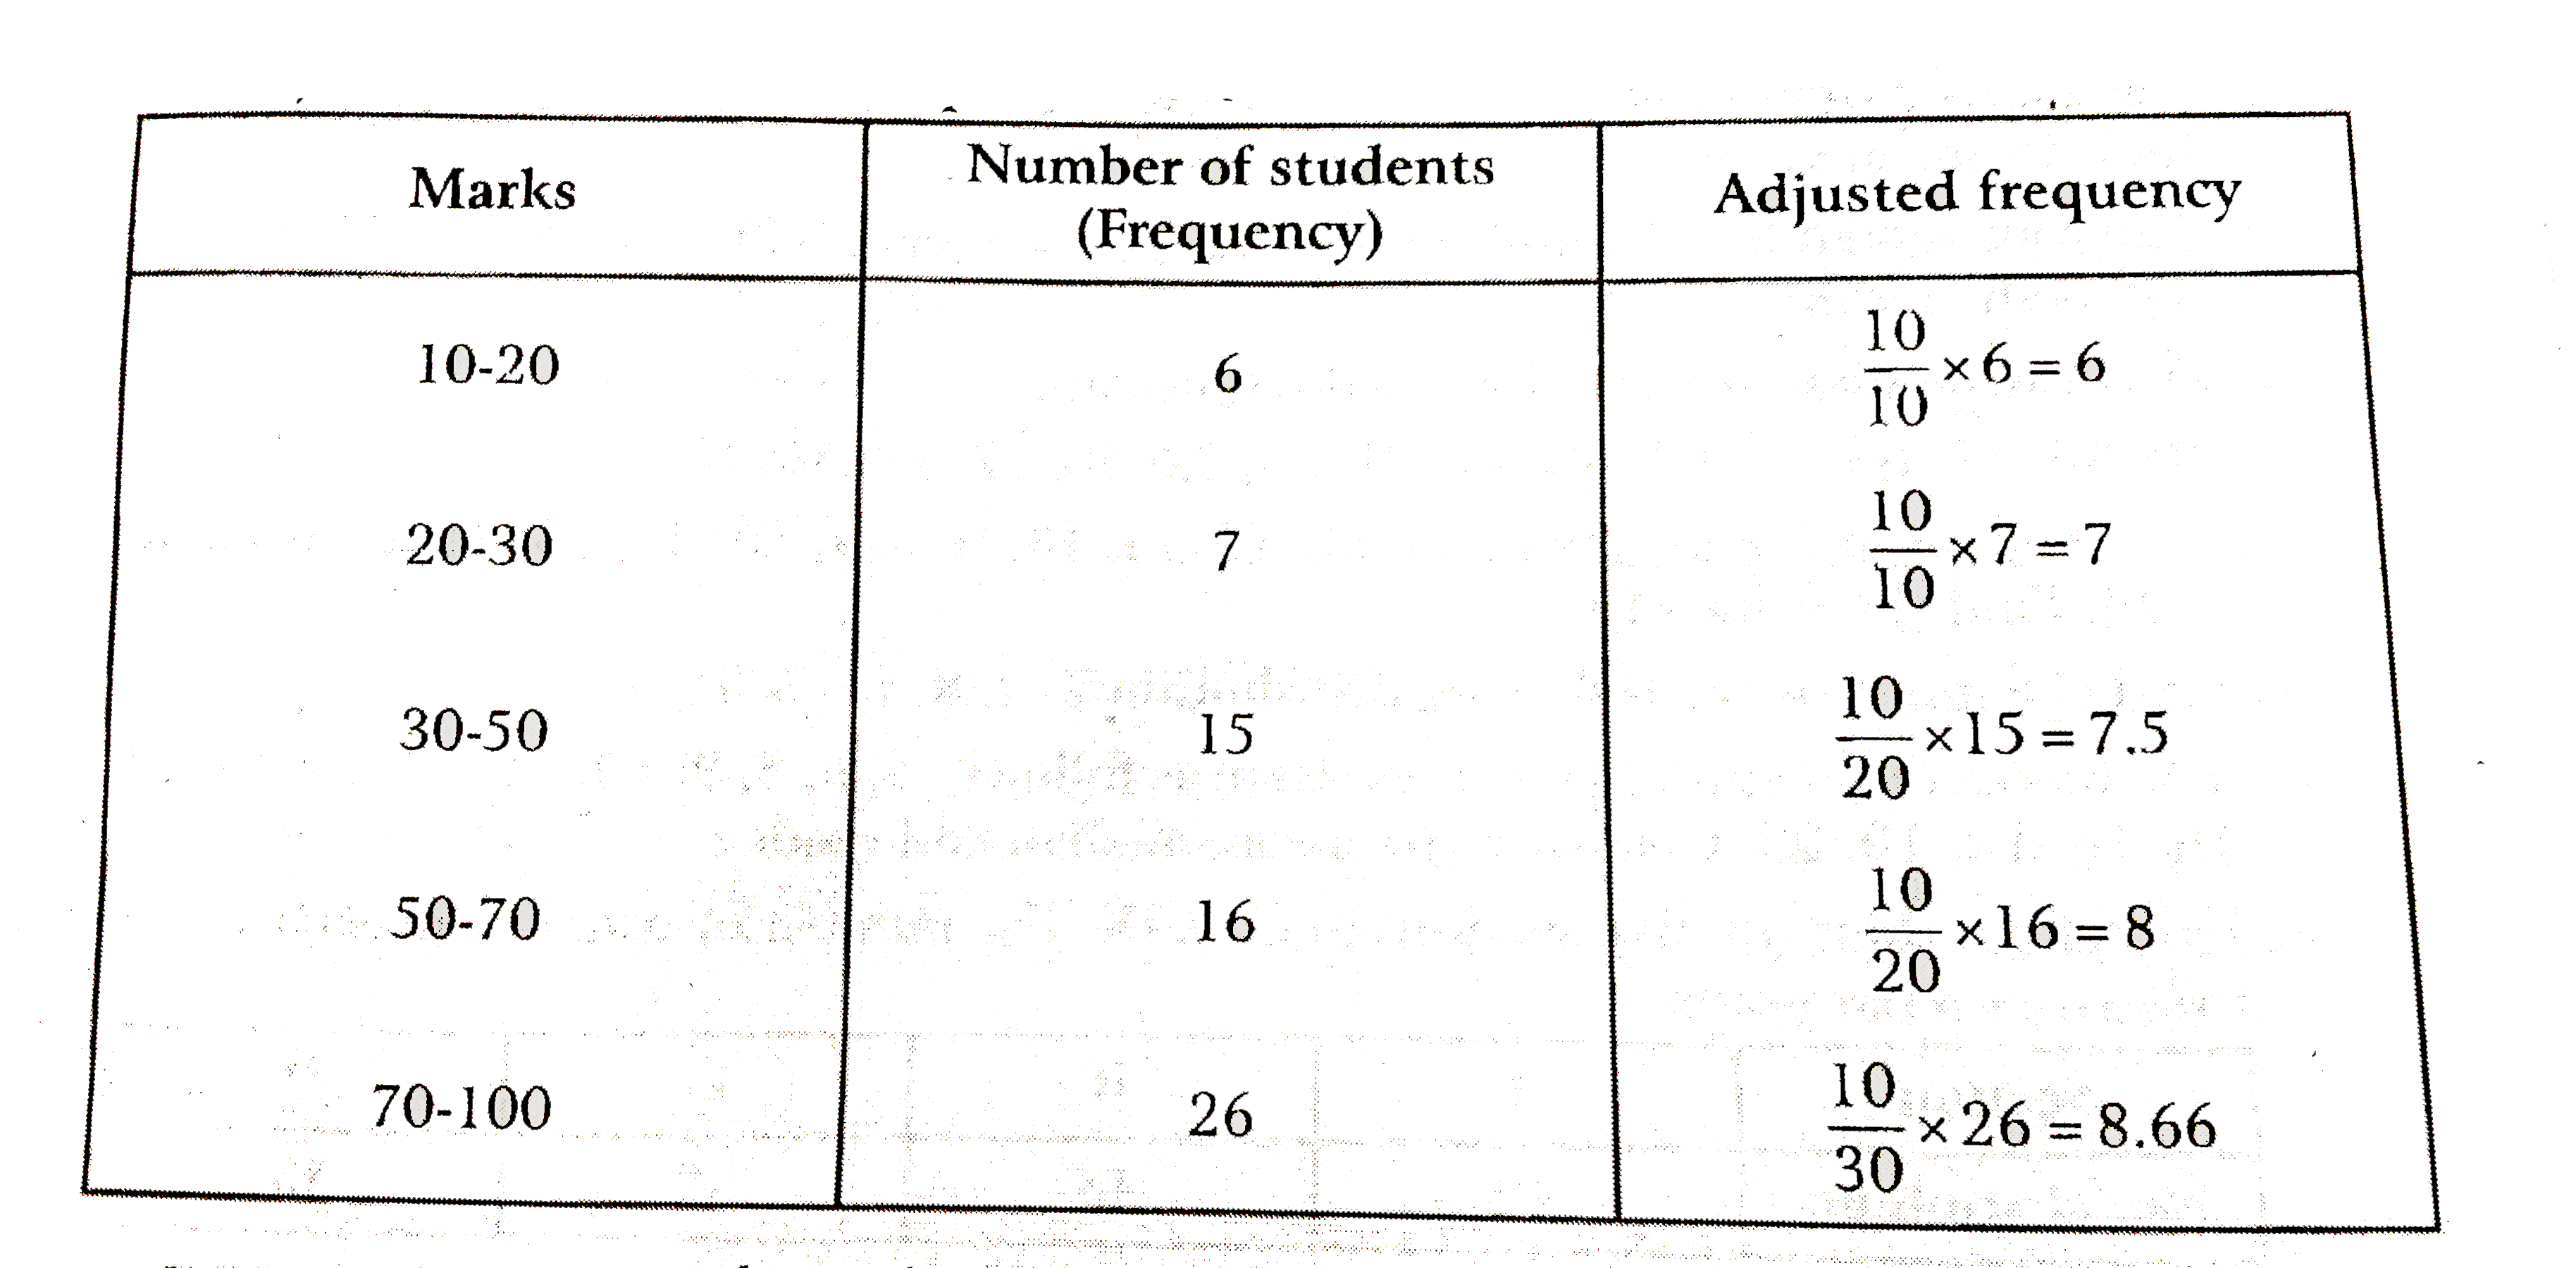 Now, we construct rectangles with class-limits as bases and respective adjusted frequencies as heights.
|
|