Saved Bookmarks
| 1. |
The marks obtained (out of 100) by a class of 80 students are given below |
|
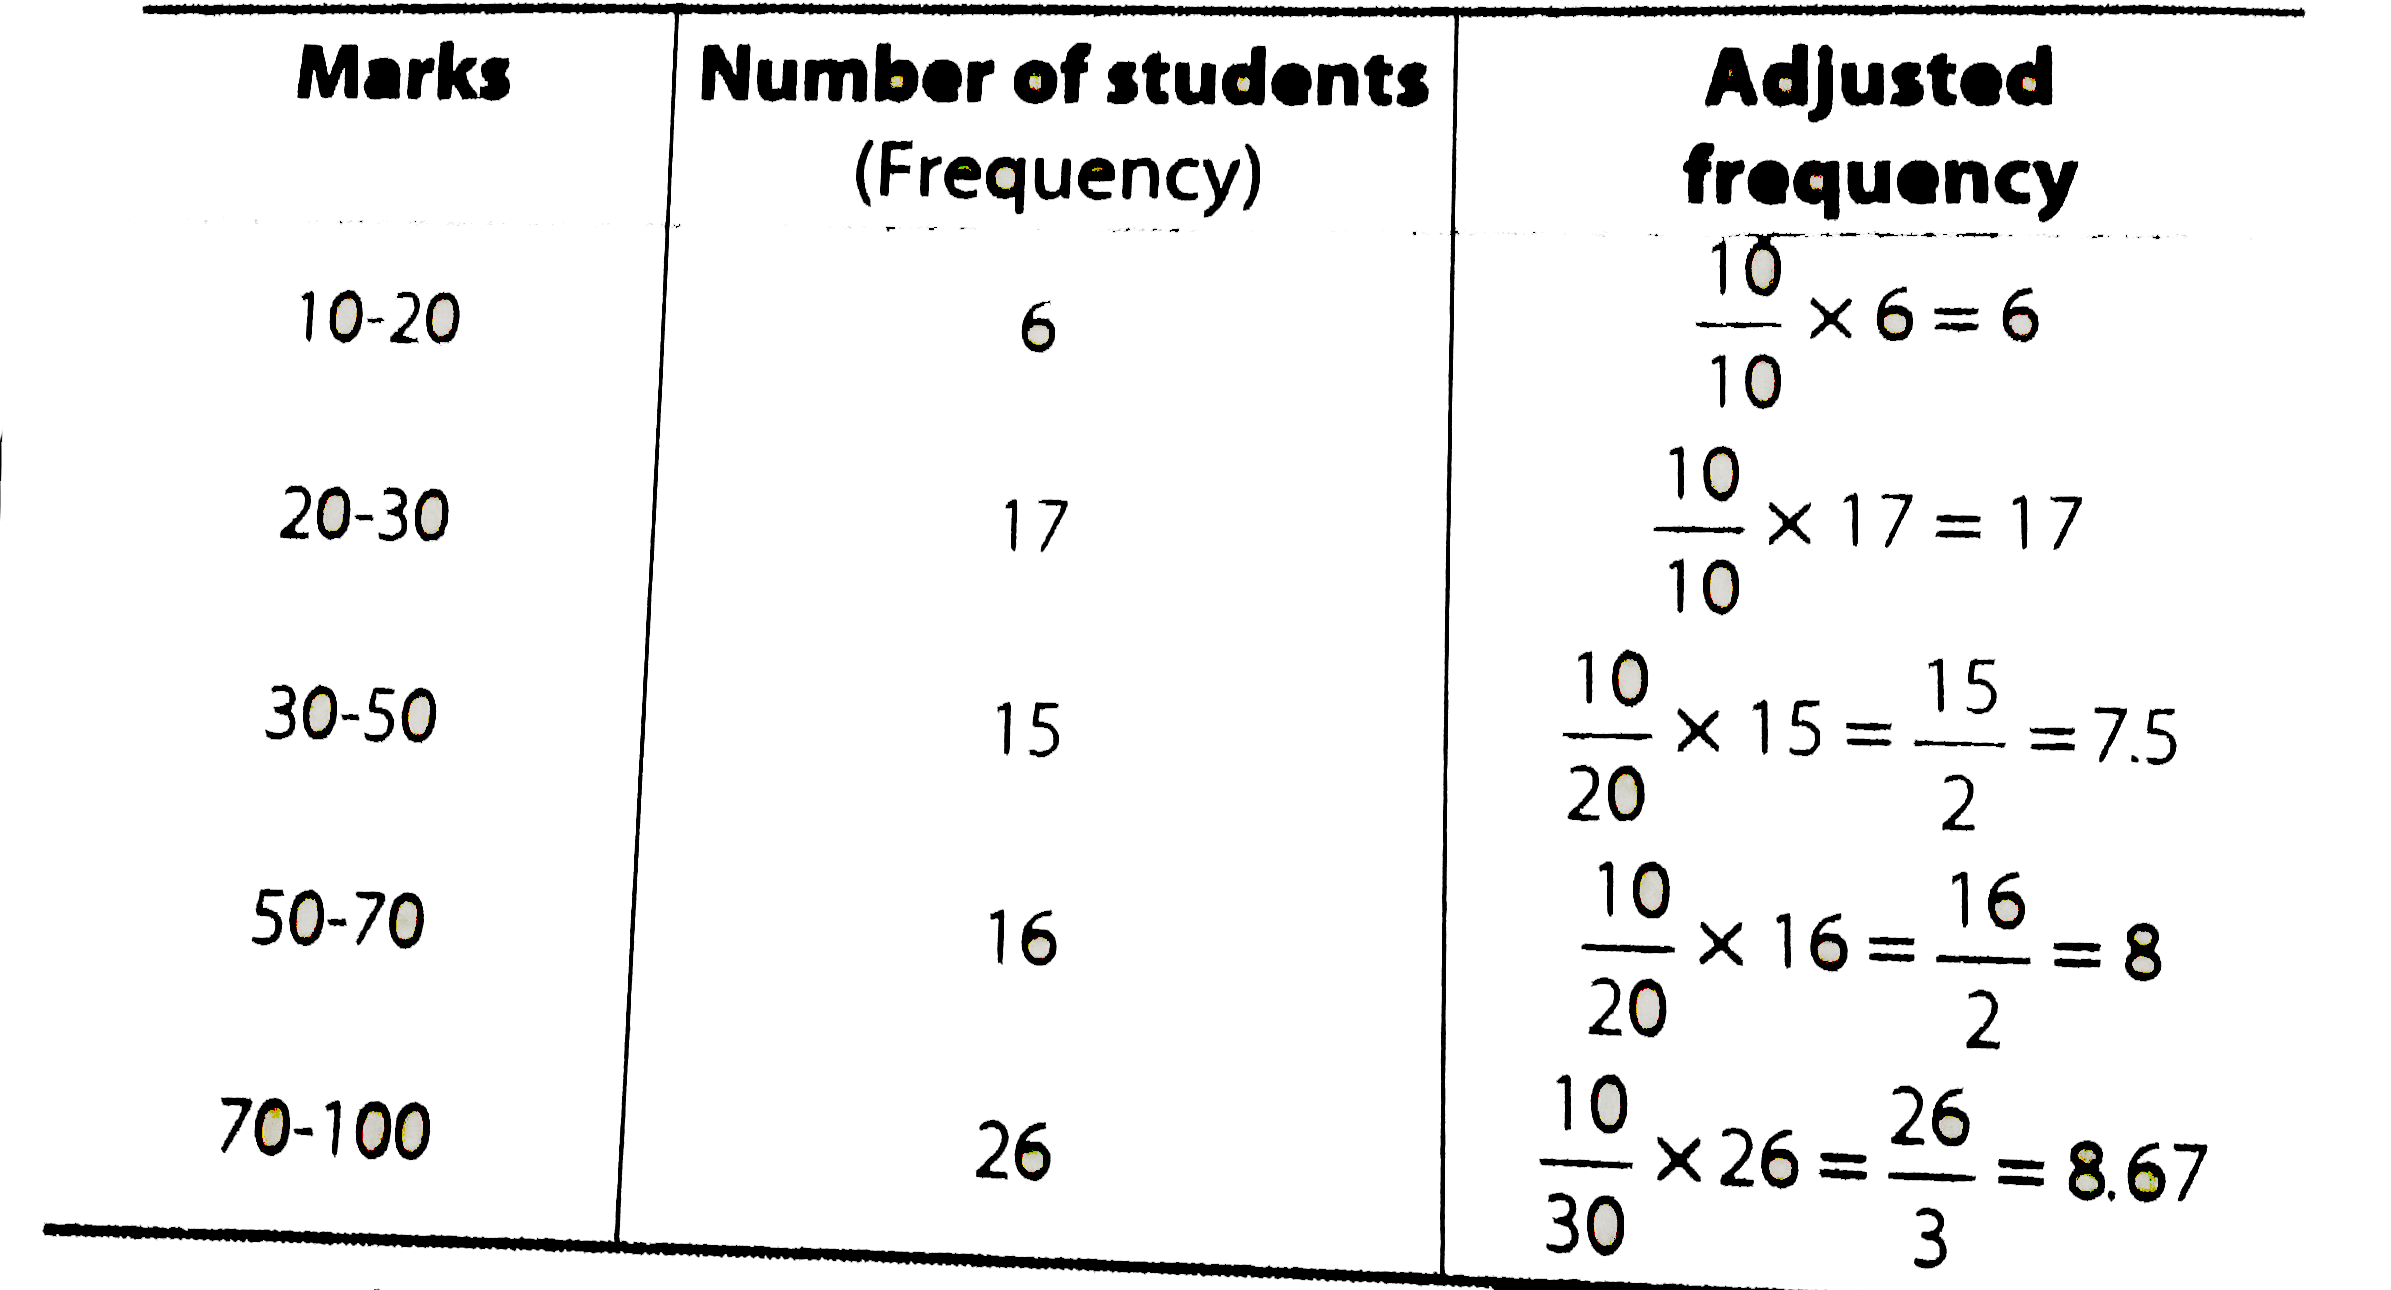
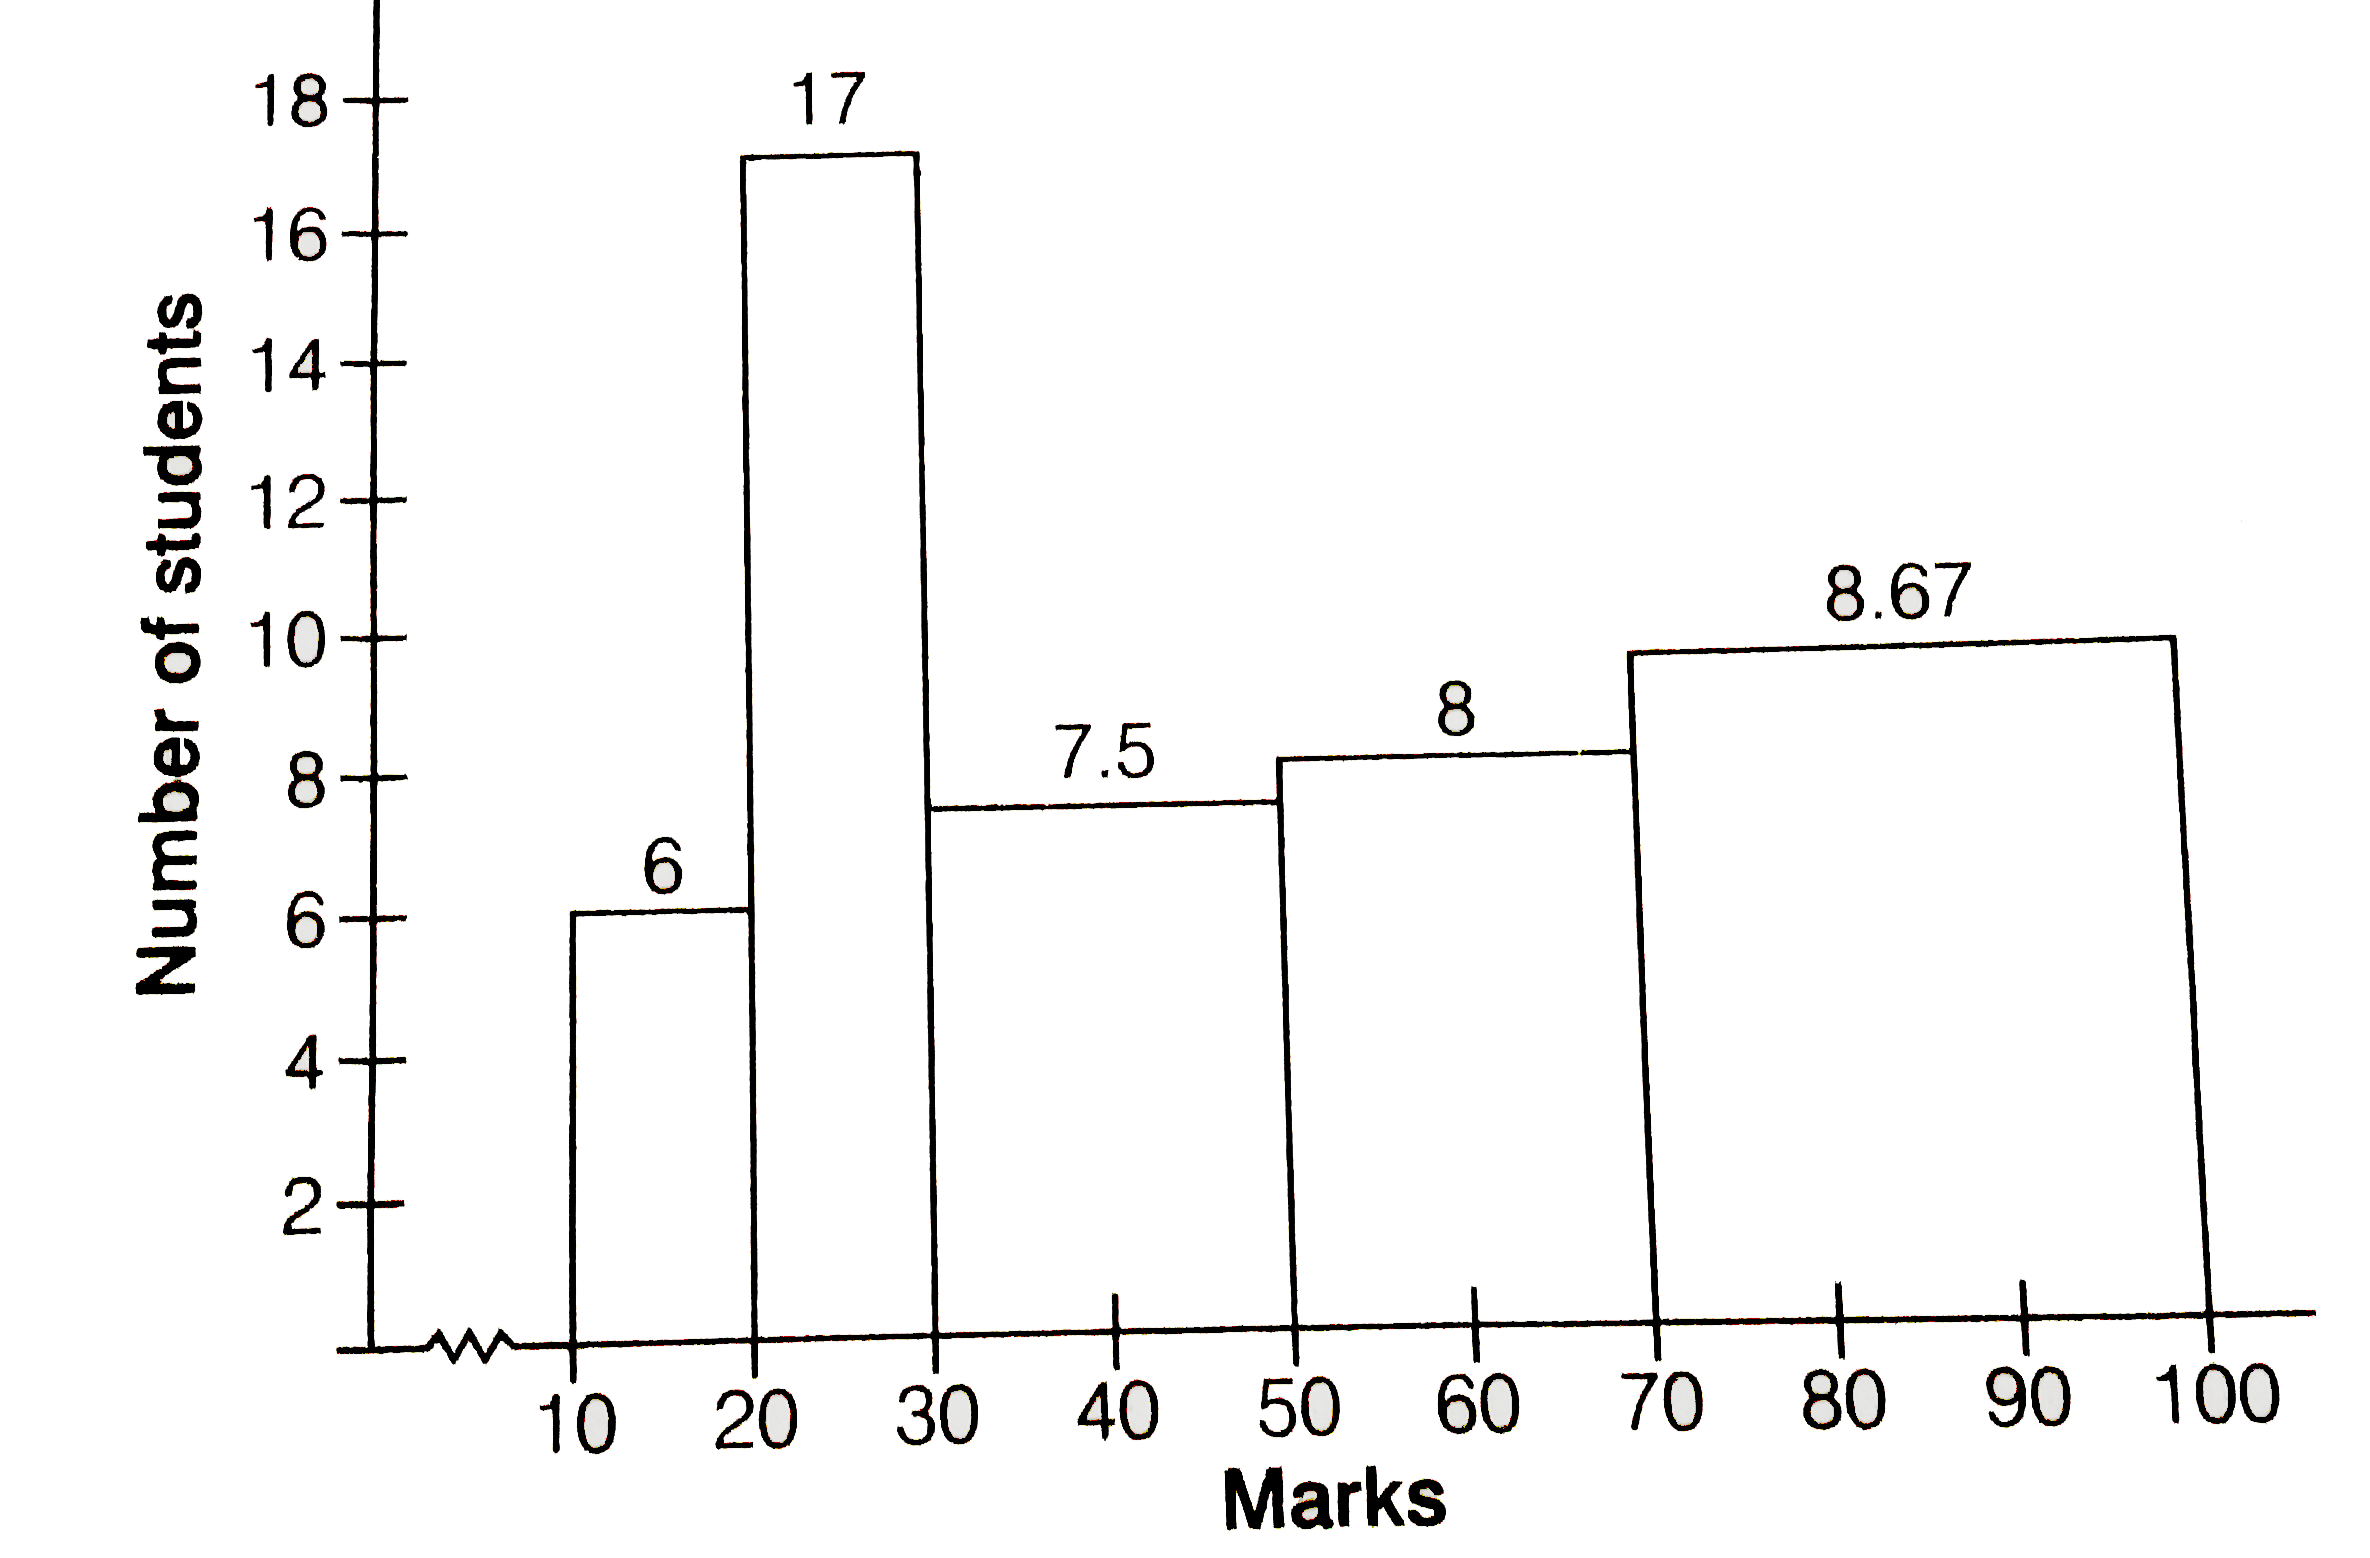
Answer» Solution :In the GIVEN frequency distribution, class sizes are different. So, we calculate the adjusted frequency for each class, Here, minimum size=20-10=10 We use the formula, Adjusted frequency of a class = `("Minimum class size")/("Class size of this class") xx "its frequency"` The modified table for frequency distribution is given below.  Along the HORIZONTAL axis, we represent the class intervls marks on some suitable scale. The corresponding frequencies of number of students are represented along the vertical axis on a suitable scale. Since, the given intervals start with 10-20. It means that, there is some BREAK INDICATED near the origin to slightly the graph is drawn with a scale beginning at 10. Now, we draw rectangles with class intervals as the bases and the corresponding adjusted frequencies as heights. A histogram of the given distribution is given below. 
|
|
Discussion
No Comment Found
Related InterviewSolutions
- Prove that 8sqrt(5) is irrational.
- A point C is said to lie between the points A and B if
- ABC is a triangle in which altitudes BE and CF to sides AC and AB are equal (see the given figure). Show that ( i ) triangle ABE ~= triangle ACF (ii) AB = AC i.e ABC is an isoceles triangle
- (a) (i) By takingany twoirrational numbers,prove that their sumis arational number. (ii) By takingany twoirrational numbers, prove that their difference is a rational number. (b) Insert in between1/7 and 2/7 (i)a rational number : (ii) an irrational number.
- Find the mean of all prime numbers between 20 and 50.
- The perimeter of an isosceles triangle is 100 cm. If the base is 36 cm, find the length of the equal sides.
- If A=60^(@), verify that : (i) sin^(2)A+cos^(2)A=1"(ii) "sec^(2)A-tan^(2)A=1
- Construct a DeltaABC whose perimeter is 10.5 cm and the base angles are 60^(@) and 45^(@).
- Draw an angle of 80^(@) with the help of protractor . Then, construct angles of (i) 40^(@) (ii) 160^(@) and (iii) 120^(@) .
- Water is pouring into a conical vessel of diameter 5.2m. And slant height 6.8 m(as shown in the adjoining ) , at the rate of 1.8 m^(3)per minute .How long will it take to fill the vessel?