Saved Bookmarks
| 1. |
The speed time graph for a car is shown in fig 8.12 Find out how far the car travels in the first 4 seconds. Shade the area on the graph that represents the distance travelled by the car during the period. |
Answer» SOLUTION :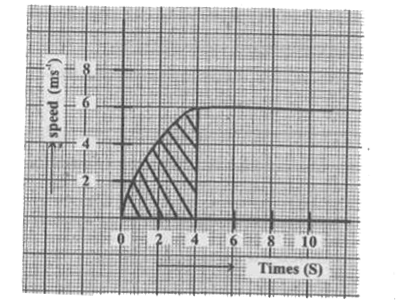 The shaded area which is equal to `½ xx 4 xx 6= 12M` REPRESENTS the DISTANCE travelled by the car in the first 4S. |
|